The McKinsey Solve Game, also known as the McKinsey Problem Solving Game, McKinsey Digital Assessment, or Imbellus Game, is a 110-minute online test designed to evaluate how candidates think rather than what they know. It assesses logic, critical thinking, and strategic reasoning through realistic consulting simulations that replace the traditional Problem Solving Test (PST). Developed in partnership with Imbellus, this game now includes three modules: Red Rock Study, Sea Wolf (Ocean Cleanup), and Ecosystem Building. Each tests how effectively candidates analyze data, plan decisions, and build solutions.
In this 2026 guide, you’ll find a full walkthrough, scoring explanation, preparation strategies, and a free playable simulation to practice for the real test.
TL;DR - What You Need to Know
The McKinsey Solve Game is a digital assessment that screens candidates through interactive problem-solving challenges.
- Duration: ~110 minutes (3 games) or ~70 minutes (2 games), taken online
- Modules: Red Rock Study, Sea Wolf (Ocean Cleanup), Ecosystem Building
- Purpose: Replaces the PST and screens candidates before interviews
- Skills Assessed: Data analysis, logical reasoning, decision-making, and systems thinking
- Tip: Practice real simulations to master timing, accuracy, and strategy
Table of Contents:
- What is the McKinsey Solve Game?
- How hard is it to pass McKinsey Solve?
- Where Does the McKinsey PSG Fit in the Interview Process?
- What Happens After You Take the McKinsey Solve Game?
- How Does the McKinsey Game Work?
- How the McKinsey Solve Game Is Scored
- What Skills Does the McKinsey Game Assess?
- What Does the Game Include?
- Why Practice the McKinsey Problem Solving Game?
- Frequently Asked Questions About McKinsey Digital Assessment
What is the McKinsey Solve Game?
The McKinsey Solve Game is an online problem-solving assessment that lasts around 110 minutes for three games or about 70 minutes for two games, depending on the candidate’s test version. It includes three modules: Red Rock Study, Sea Wolf, and Ecosystem Building, and it replaces the PST. The game tests logic, critical thinking, and strategic reasoning in realistic consulting simulations.
This Problem Solving Game is a key screening step in McKinsey’s U.S. and global hiring. It screens most applicants before interviews. As of 2026, the assessment includes three games: Ecosystem Building, Red Rock Study, and Sea Wolf (also called Ocean Cleanup).
The assessment evaluates both outcomes and approach through product and process scores.
Ready to practice? Check out the only, fully-playable, and FREE McKinsey Solve Test (Problem-Solving Game) Simulation, designed for both U.S. and international candidates preparing for the 2026 cycle. Used by over 10,000+ McKinsey candidates annually.
The one and only existing platform to practice three McKinsey PSG simulation games for FREE!
Is McKinsey Solve the Same as PSG or Imbellus?
Yes. McKinsey Solve, the Problem Solving Game (PSG), the Imbellus Game, and the McKinsey Digital Assessment all refer to the same screening test. When the test was first introduced, it was developed in partnership with a company called Imbellus. For that reason, early candidates referred to it as the Imbellus Game. Over time, the name shifted to PSG, and it is now officially called the McKinsey Solve Game.
You may also come across other names like "Digital Assessment" or even specific games like "Redrock" or "Sea Wolf" used to describe the test. Despite the different names, they all refer to the same computer-based assessment that evaluates how candidates solve problems, make decisions, and process information.
The test has evolved over the years. As of 2026, it includes three scenarios: Ecosystem Building, Redrock, and Sea Wolf. Each is designed to test your cognitive and strategic thinking in a game-like environment.
Timeline of the McKinsey Game: From Imbellus to Sea Wolf
| Year | Name Used | Key Update |
|---|---|---|
| 2019 | Imbellus Game | First introduced as a pilot in select offices |
| 2020 | Problem Solving Game (PSG) | Rolled out globally as a standard test |
| 2022 | McKinsey Solve | Rebranded officially as "Solve" |
| 2023 | Redrock Introduced | Business-focused game added to replace plant defense |
| 2025 | Sea Wolf Game | New scenario added to simulate ocean cleanup |
How hard is it to pass McKinsey Solve?
McKinsey Solve is difficult for most candidates. It combines unfamiliar game mechanics with time pressure, strategic reasoning, and no room for error. The pass rate is estimated to be under 20%, and even strong candidates often fail due to lack of preparation. Practicing beforehand is critical.
One key reason the game feels difficult is that most candidates underestimate how different it is from traditional case interviews. Instead of verbal or written answers, you're solving through interactive simulations that test cognitive agility.
For example, the Red Rock module tests your ability to process large amounts of business data, identify key insights, and complete a time-sensitive analysis and reporting task across three structured phases: Investigation, Analysis, and Report, followed by six mini cases involving numerical and logical reasoning. Meanwhile, the Sea Wolf module challenges your pattern recognition skills by asking you to evaluate biological traits across microbes and assign them to the correct sites under strict constraints, requiring both accuracy and mental agility.
McKinsey rarely discloses pass/fail rates officially, but anecdotal data and community feedback suggest that the majority of applicants do not pass this stage. That’s why prep resources, realistic simulations, and understanding how the game is scored can make a significant difference.
Kickstart Your Consulting Prep Journey?
Click the image below to get your free Consulting Starter Pack
.png)
Where Does the McKinsey PSG Fit in the Interview Process?
Within McKinsey's hiring process, the McKinsey assessment game is screening test, positioned between the application and the case interviews. Its primary objective remains consistent with the traditional Problem-Solving Test: to efficiently identify suitable candidates and streamline the resource-intensive case interview phase. This applies across global offices, including in highly competitive U.S. offices such as New York, Boston, and Chicago, where thousands of applicants are screened using the Solve Game each cycle before case interview. This approach optimizes both time and resources in the recruitment process. For those curious about the next steps, explore what to expect in a McKinsey salary across levels.
Please see the McKinsey interview process below:
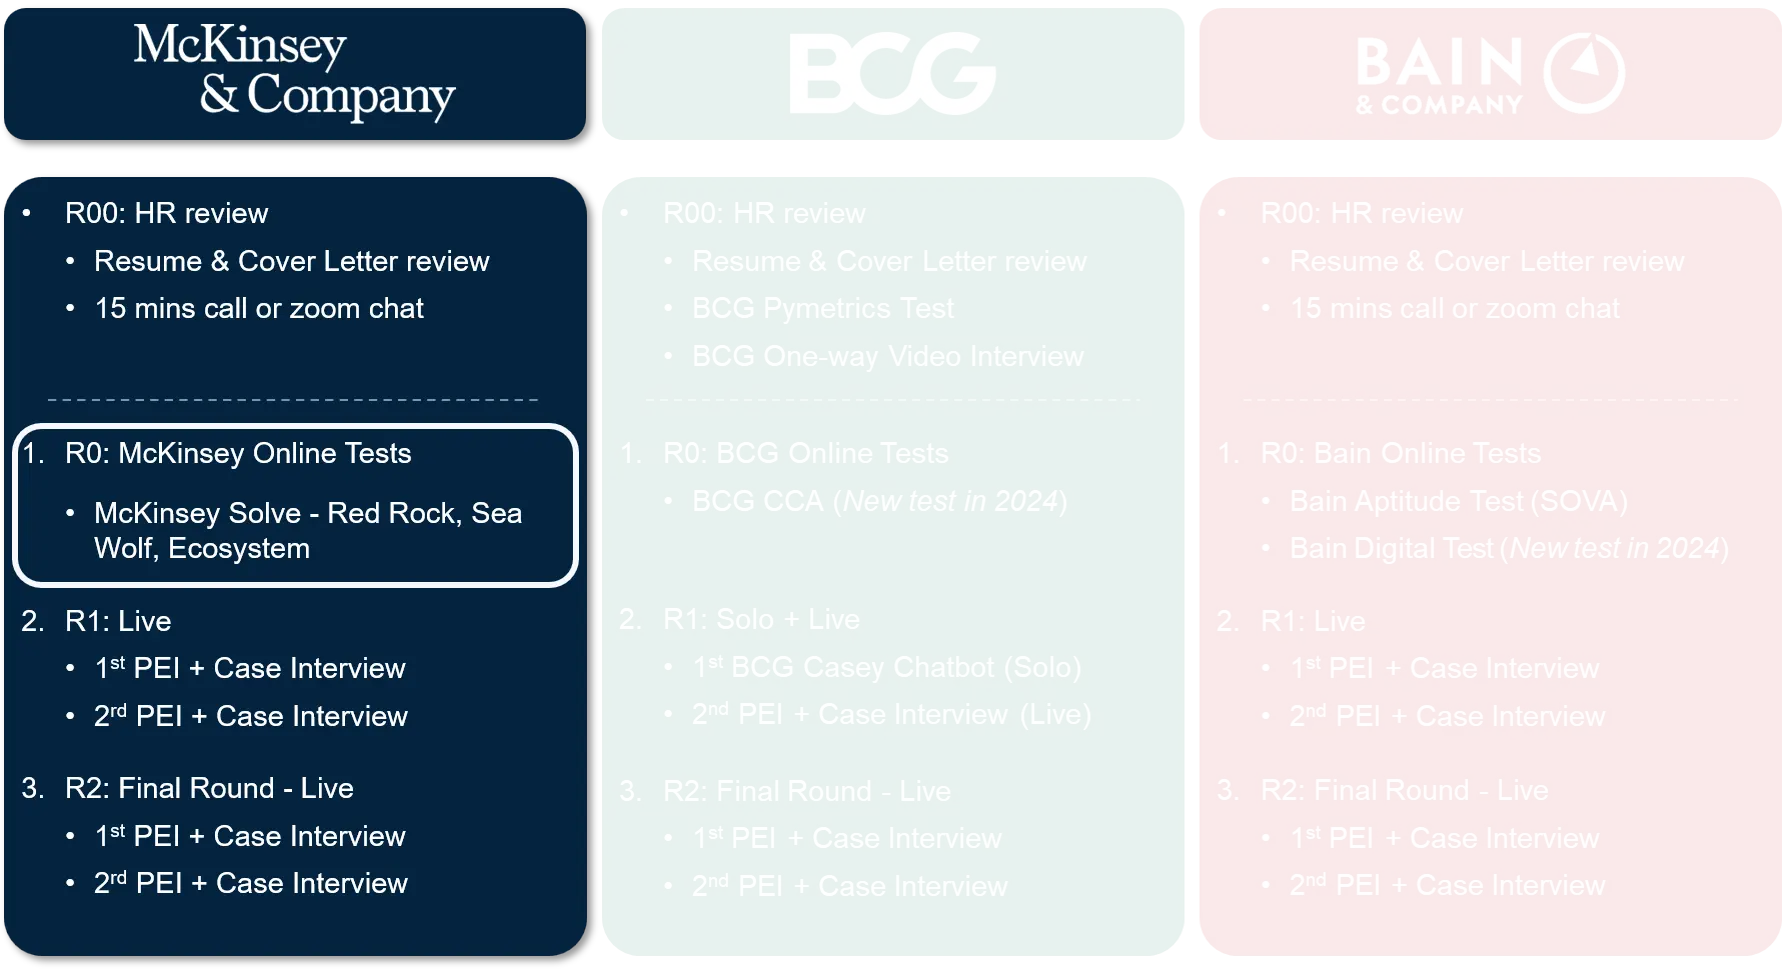
Figure: McKinsey Solve in the Interview Process
NOTE - MBBs constantly edit their hiring steps & tests. All possible steps are listed. You might not get all of them. The steps are indicative. You will get specifics from MBB recruitment. Follow those.
Is everyone invited to McKinsey Solve?
No. McKinsey Solve is invite-only. Candidates who pass initial resume screening or referrals are sent an invitation to play the game. Not all applicants are invited to Solve.
What Happens After You Take the McKinsey Solve Game?
After completing the McKinsey Solve Game, you will either be invited to the next round of interviews or notified that your application will not move forward. The outcome depends heavily on your performance in the game, which is used to filter candidates before case interviews.
What happens if I fail McKinsey's Solve?
If you fail the McKinsey Solve Game, you likely will not be invited to interview. Solve is a key screening step, and most candidates who do not meet the benchmark receive a rejection email within 1 to 2 weeks. In most cases, you can reapply after 6 to 12 months depending on your location and school or program policies.
How long after McKinsey Solve do you hear back?
You’ll typically hear back within 7 to 14 days after completing McKinsey Solve. This can vary by recruiting cycle, location, and applicant volume. If you're applying through a campus program, schools often release interview invites in coordinated batches.
What happens after you pass McKinsey Solve?
Passing the McKinsey Solve Game usually means you're moving forward to case interviews. You may be invited to one or two rounds, depending on the office and role. These interviews include personal experience questions and classic McKinsey-style case studies, often led by Associates or Engagement Managers.
How long to wait after McKinsey Solve?
If you haven’t heard back within two weeks, it’s still within the typical timeline. Wait times can be longer during peak recruiting seasons. If you're unsure, follow up politely with the recruiting team after 14 days to check your status.
How Does the McKinsey Game Work?
The test includes three core games. The assessment evaluates both your final answers and the problem-solving process itself. If a candidate demonstrates decision-making patterns and cognitive skills aligned with those of a McKinsey consultant, they may receive an interview invitation.
Currently, the Solve game features three active games: Ecosystem Building, Red Rock Study, and Sea Wolf (also known as Ocean Cleanup). Nearly 100% of candidates begin with Ecosystem Building as the first challenge. In 2024, McKinsey introduced the Sea Wolf Game as a third game.
Please note that the other three games, namely Disaster Management, Disease Management, and Migration Management, were previously used by McKinsey for beta testing purposes. However, they are no longer included in the test in 2023. Plant Defense has also been phased out and is no longer used in the current version of the test.
How long does McKinsey Solve take?
The full McKinsey Solve Game takes approximately 110 minutes to complete. Each game module is timed, and candidates must finish all parts in one sitting.
Time spent on tutorials is not counted toward the total limit. Candidates are encouraged to use this period to:
- Understand the structure and mechanics of the upcoming game
- Strategize a general approach
- Prepare tools like pen, paper, or an Excel sheet to organize their thoughts efficiently
To experience how the McKinsey Problem Solving Game works firsthand, sign up for our Free McKinsey PSG Simulation and give it a try!
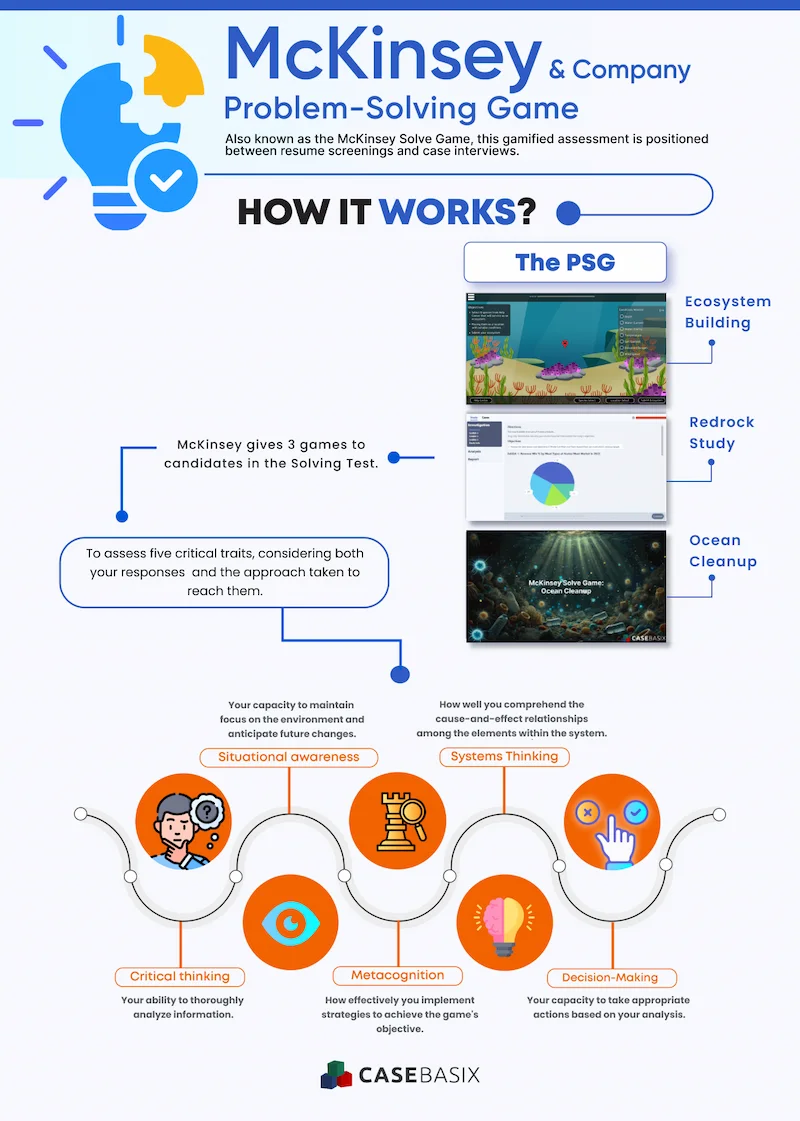
Figure: McKinsey Solve Game Overview
How the McKinsey Game Is Scored
One thing that surprises many candidates about the McKinsey digital assessment is how it’s scored. It’s not like a traditional test that only checks if your answers are right. Instead, McKinsey evaluates both your result and how you got there. This is done through a two-part scoring system.
1. Product Score
This refers to the final outcomes you submit. In the Ecosystem game, for example, this includes whether your food chain is stable and whether all species survive. In the Redrock case, it includes the accuracy of your calculations and conclusions. This part of the score reflects the quality of your answers.
2. Process Score
This is what sets this game apart. Every click, drag, and decision you make is tracked. McKinsey looks at how you approach problems, how often you change direction, whether you backtrack, and how you prioritize information. This part of the score measures your problem-solving process, not just your outcome.
Your final score is a combination of both. Even if your answers are correct, a disorganized or rushed approach can lower your process score. On the other hand, a structured and logical approach can help you stand out, even if a few answers are off.
This is why preparation is not just about knowing the right answer. It is also about building habits that demonstrate clear thinking, planning, and strategic decision-making under pressure.
What Skills Does the McKinsey Game Assess?
The McKinsey game assesses five critical cognitive abilities:
- Critical Thinking: Your ability to thoroughly analyze information.
- Decision-Making: Your capacity to take appropriate actions based on your analysis.
- Metacognition: How effectively you implement strategies to achieve the game's objective.
- Situational Awareness: Your capacity to maintain focus on the environment and anticipate future changes.
- Systems Thinking: How well you comprehend the cause-and-effect relationships among the elements within the system.
The positive aspect is that many of the assessed skills are interconnected, meaning that improving one area can also enhance performance in others. This is crucial because it allows you to avoid diving into every tiny detail just to achieve a higher score. These core skills such as critical thinking and systems awareness mirror the competencies used daily by entry-level consultants. You can see what an Associate at McKinsey does in real projects.
Additionally, while showcasing all abilities is essential for success, some skills carry more weight. Based on the insights from this Imbellus research paper, Critical Thinking, Situational Awareness, and Systems Thinking are the core competencies that top candidates must demonstrate.
Advanced abilities such as Decision-Making and Meta-Cognition, on the other hand, are what separate great candidates from the rest. Skills like meta cognition and advanced decision making are especially important at the manager level. See what an Engagement Manager at McKinsey does to understand how these abilities are applied in real consulting work.
What Does the Game Include?
Many candidates preparing for McKinsey interviews ask, “What exactly is included in the Solve McKinsey Game?” This section gives you a visual and practical breakdown of all three game modules: Ecosystem Building, Red Rock, and Sea Wolf (Ocean Cleanup) so you can understand how each game works and how to practice effectively. If you are serious about acing the McKinsey Problem Solving Game (PSG) in 2026, watch the video overview below to get started.
This preview shows the interface layout of the McKinsey Solve Game.
Red Rock Study
This is a game with a 35-minute time limit, during which you will complete the Red Rock Study, consisting of both Part 1 and Part 2.
Experience the Redrock Study game firsthand by trying our FREE Simulation today.
The McKinsey Red Rock Study divides the tasks into 2 parts:
- Part 1: Study
- Part 2: Cases
In Part 1, you'll get one study with a main goal and some data to support it. This part has three steps:
- Phase 1: Investigation
- Phase 2: Analysis
- Phase 3: Report
In Part 2, you'll receive 6 short cases that are related to the same topic but not directly connected to the Part 1 Study. Each case will come with two different types of questions:
- Multiple choice questions
- Numerical answer questions
You need to finish both tasks (Part 1 & Part 2) within a total time limit of 35 minutes. Although there are no specific time constraints for each part, it's advisable to allocate more time to the first part and less to the second part.
Now, let's delve into the specifics of Part 1 and Part 2 of the tasks.
Part 1: Study
Phase 1: Investigation
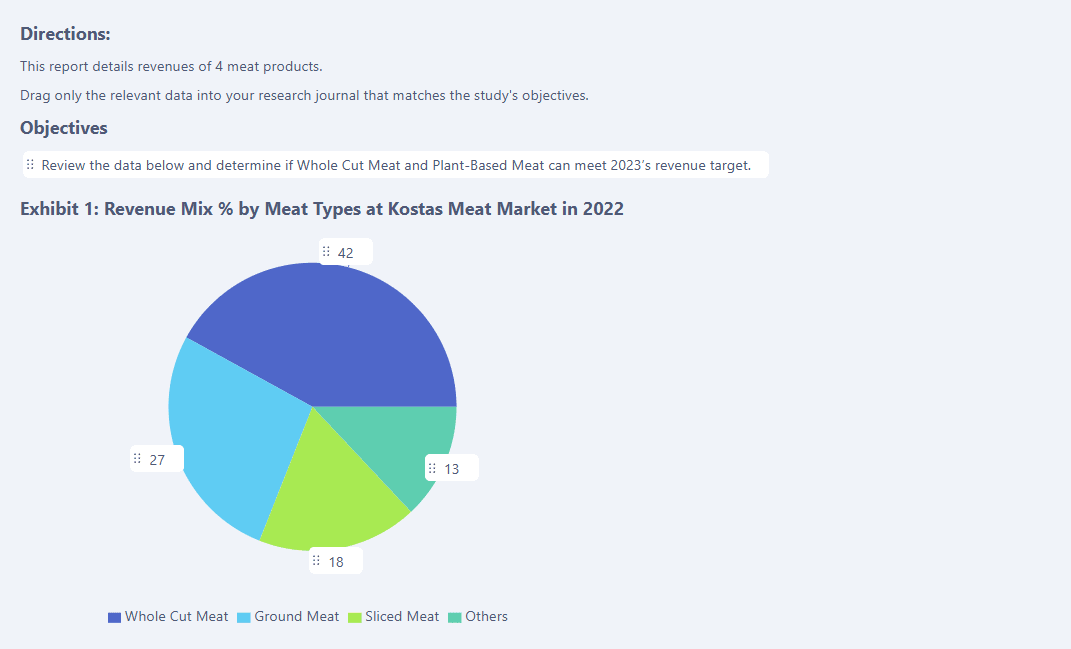
Figure: Red Rock Study interface from the McKinsey Solve Game, showing the study objective and revenue mix chart by meat type at Kostas Market.
Your goal is to read through the case description, recognize the main objective and essential data points, and then gather them in an on-screen Research Journal.
The data and information provided are divided into three sections, with each section containing the necessary information required to complete the study:
- Objective
- Exhibits
- Study Information
How to tackle this phase:
- Understanding the study
- Collecting important data points
1. Understanding the study
Your objective here is to identify case’s objectives.
Every piece of information displayed on the screen is crucial for comprehending and resolving the case. However, some are more critical than others. Significant data points are highlighted and displayed in boxes on the screen, allowing you to click and drag these boxes to focus on them while working within the case.
The data provided comes in two formats:
- Text-based data, which is divided into two types:
- Movable data points: These text-based data points consist of case objectives and calculation instructions. They clarify the case's goal, specify the mathematical formulas to be applied, and outline which numbers need to be gathered. Typically, these are detailed sentences or paragraphs that describe the relationships (such as higher, lower, etc.) between the elements within the case.
- Non-Movable data points: These text-based data points encompass background information and test instructions. They are not selectable or movable and are intended solely to provide an overview of the case. They do not need to be collected as their purpose is to offer context.
- Number-based data: These typically consist of movable data points and comprise the majority of the data in the case. They can be found in two locations: within charts, diagrams (such as bar charts, pie charts, tables, etc.), or within the text. It's necessary to gather these numbers into the journal for calculations in the next phase.
2. Collecting important data points
You can drag any movable data point into the Research Journal to collect. In the Research Journal, each collected piece of information will appear as a card, with its own name and description. The data in the Research Journal can then be used in the Calculator or as answers in phase 2.
You have the option to change the labels for all the data yourself. We suggest doing this if the default label doesn't describe the contents well enough. Using the right labels will make your analysis faster because it helps you easily find the important data later on.
After you've collected the data, you can also include your own notes with each piece of information. This can assist you in explaining the information required during the Analysis phase.
Here’s a summary of our recommended approach:
- Determine the objectives of the case.
- Identify the mathematical formulas needed to address these objectives.
- Collect in your Research Journal only the essential data points necessary for the calculations during the Analysis phase.
Phase 2 – Analysis
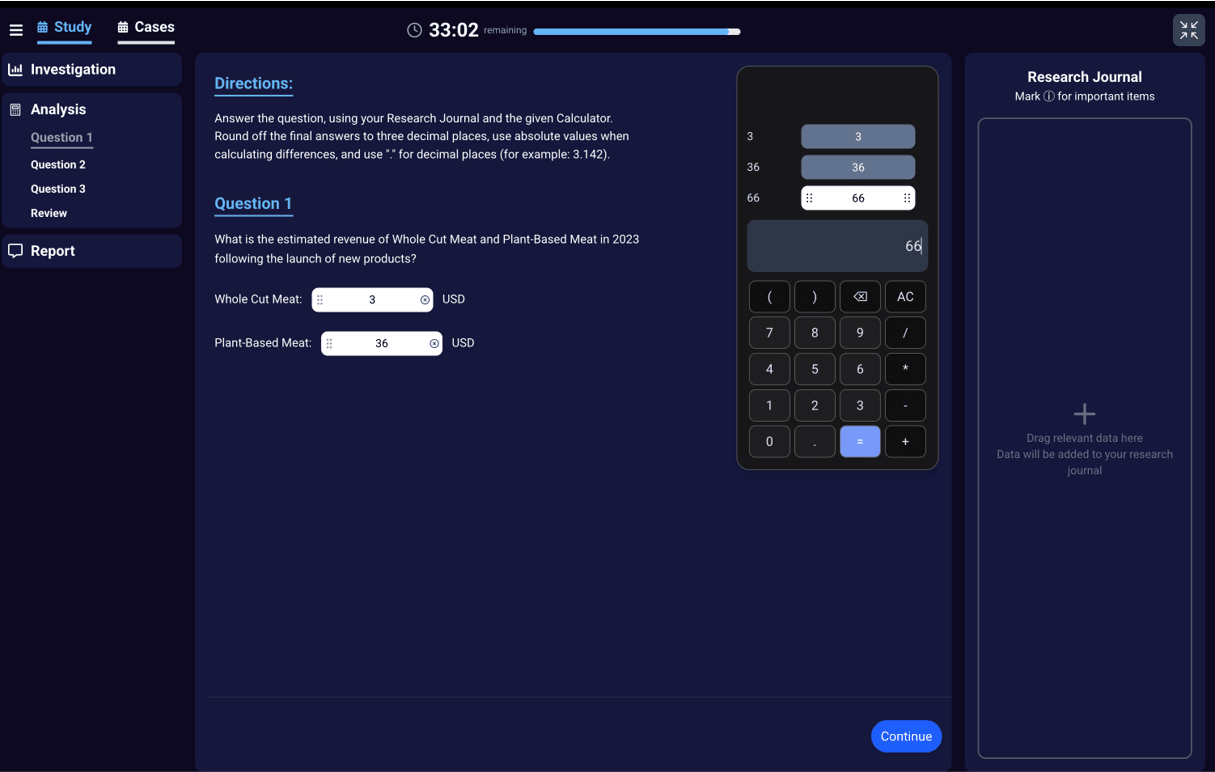
Figure: Red Rock Study interface from the McKinsey Solve Game, showing questions in Analysis Phase (with calculator)
Your objective here is to use the data points gathered during the Investigation phase to answer three quantitative questions using the provided calculator. These answers will be utilized to complete the report in Phase 3.
The three quantitative questions typically consist of 2 to 3 sub-questions, each with an answer input gap that requires a response from the calculator. To address these questions, you need to input the numerical data points you've collected into an on-screen calculator and then transfer the results to the corresponding gaps.
The calculator features a straightforward interface, resembling a digital calculator found on a phone, and includes basic operators such as multiplication (x), addition (+), subtraction (-), and division (÷).
The calculations required for the questions can be categorized into two types:
- Basic Operations: This category includes addition, subtraction, multiplication, and division. While these operations are fundamental, you may need to use them in combination to perform more complex calculations.
- Percentages/Ratios/Fractions: These calculations are used to address questions related to relationships, such as percentage differences, growth rates, and similar concepts.
We advise you to carry out all calculations using the provided calculator since all your actions are documented in a history log. It's safe to assume that the process you follow in arriving at the answers will also impact the final results.
It's crucial to keep in mind that the answers you obtain from these questions are almost always required in the Report phase. Therefore, it's essential to consistently record your answers in the journal.
How to tackle this phase:
- Carefully read the questions to understand what is being asked.
- Drag the relevant data points from your Research Journal into the calculator's input screen to perform the necessary calculations to answer the questions.
- Drag the results and drop them into the empty spaces provided under the questions.
- Ensure that you collect the answers in your Research Journal for use in the Report Phase.
Phase 3 - Report
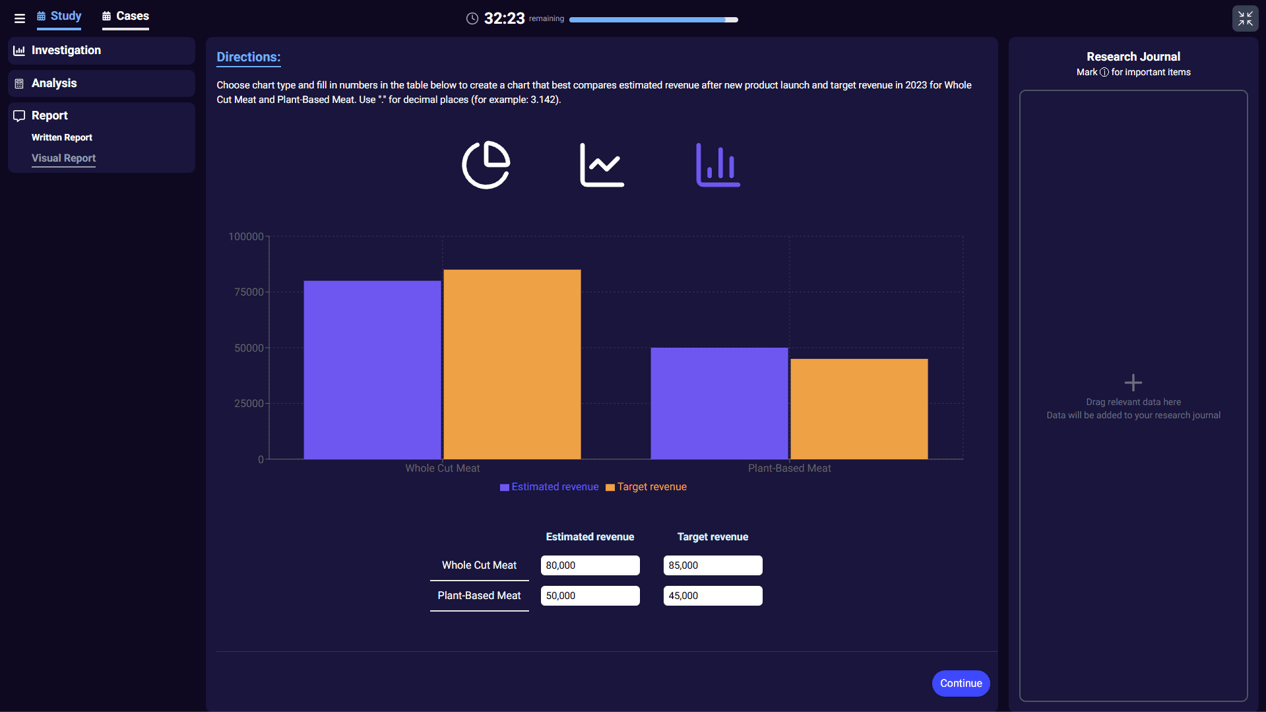
Figure: Red Rock Study interface from the McKinsey Solve Game showing visual charts in Report Phase
Your objective here is to finalize the textual and graphical report. You will have the option to choose one of three types of graphs to include in the report, and these graphs will be based on the results calculated in Phase 2.
The Report phase is the final segment of Part 1 Study and comprises two sections: the Written Report and the Visual Report.
- Written Report: This summary report involves completing the text-format report by filling in the blanks with numbers obtained in the preceding phases, as well as using expressions like "higher," "lower," "equal to," and so on. The blanks in this phase are likely to resemble the answer inputs in the Analysis phase.
- Visual Report: This aspect involves data visualization, where you select the appropriate chart type and input the numbers to create a meaningful chart for the report.
Part 2: Cases
Your objective is to answer 6 cases, each featuring a question with instructions, textual information, and data exhibits.
In each of the 6 cases, there is an onscreen tool available to aid you. It's essential to solve the cases in a sequential manner, which means you cannot skip ahead and must address one case before proceeding to the next.
All 6 cases will revolve around the same theme or topic as Part 1 of the study, but they are not interconnected. These cases primarily demand a basic level of quantitative or reasoning skills and do not necessitate advanced mathematical abilities.
However, it can be challenging to solve all 6 questions within a short time limit, so it's important to use your time wisely.
The question types in Part 2 can be grouped into four primary categories:
- Word problems: These involve mathematical exercises where candidates must read the text and interpret data to find solutions.
- Formulae: These questions are similar to word problems, but candidates only need to identify the formula used for calculation.
- Verbal Reasoning: These are single-select multiple-choice questions that ask candidates to determine which statement is true or false.
- Visualization: These questions require candidates to choose the appropriate chart type to represent the provided data.
Sea Wolf Game (Also Known as Ocean Cleanup)
What is Sea Wolf Game?
Introduced by McKinsey in 2024, the Sea Wolf Game is the newest game in the McKinsey Problem Solving Game series. Also referred to as the McKinsey Ocean Treatment Game or McKinsey Ocean Cleanup, this game challenges candidates to restore polluted ocean ecosystems by strategically selecting microbial species to reduce plastic pollution.
The primary objective is to build effective treatments for three ocean sites, each with unique requirements. For every site, you’ll go through a step-by-step selection process to choose three microbes. The goal is to match their characteristics as closely as possible to the site’s conditions.
What are the key details of this game?
- Time Limit: You have 35 minutes total to complete all three sites
- Game Order: The Sea Wolf Game follows the Ecosystem Building and Redrock Study in the Solve Game sequence.
Sea Wolf Game Mechanics
The Sea Wolf Game focuses on forming the right combination of microbes for each ocean site. Each site has a unique set of characteristic requirements, and each microbe has a combination of attributes and traits that affect how well it performs.
Your objective is to treat a site effectively, your selected team of three microbes must meet the following criteria:
- The average of each attribute (across the 3 microbes) must fall within the site’s specified range
- The undesirable trait must be completely absent from all three microbes
- The desirable trait must be present in at least one microbe
This process is repeated three times, once for each ocean site, using a different set of microbes each time.
Key Concept and Definitions
1. Characteristics
Both the ocean sites and microbes are defined by two types of characteristics:
- Attributes: These are three numerical values ranging from 1 to 10, representing properties such as permeability, mobility, or energy. For instance, a microbe has a permeability score of 7.
- Traits: Four binary traits that indicate whether a trait is present or not. If present, the trait can be either desirable or undesirable. Examples include light sensitivity, aerobic, or heat resistance.
2. Site Requirements
Each site has a defined set of targets for a treatment to be considered effective:
- A target range for each of the three numerical attributes (e.g., mobility between 6 and 8)
- One trait that is considered desirable
- One trait that must be avoided (undesirable)
Note: In some cases, not all traits will be shown. For example, the game might omit an undesirable trait for a site and only show a desirable trait. Sometimes a site can show 1 desirable and 1 undesirable trait. There are three sites in a game. The three sites can show any combination of traits and all three sites can have different traits.
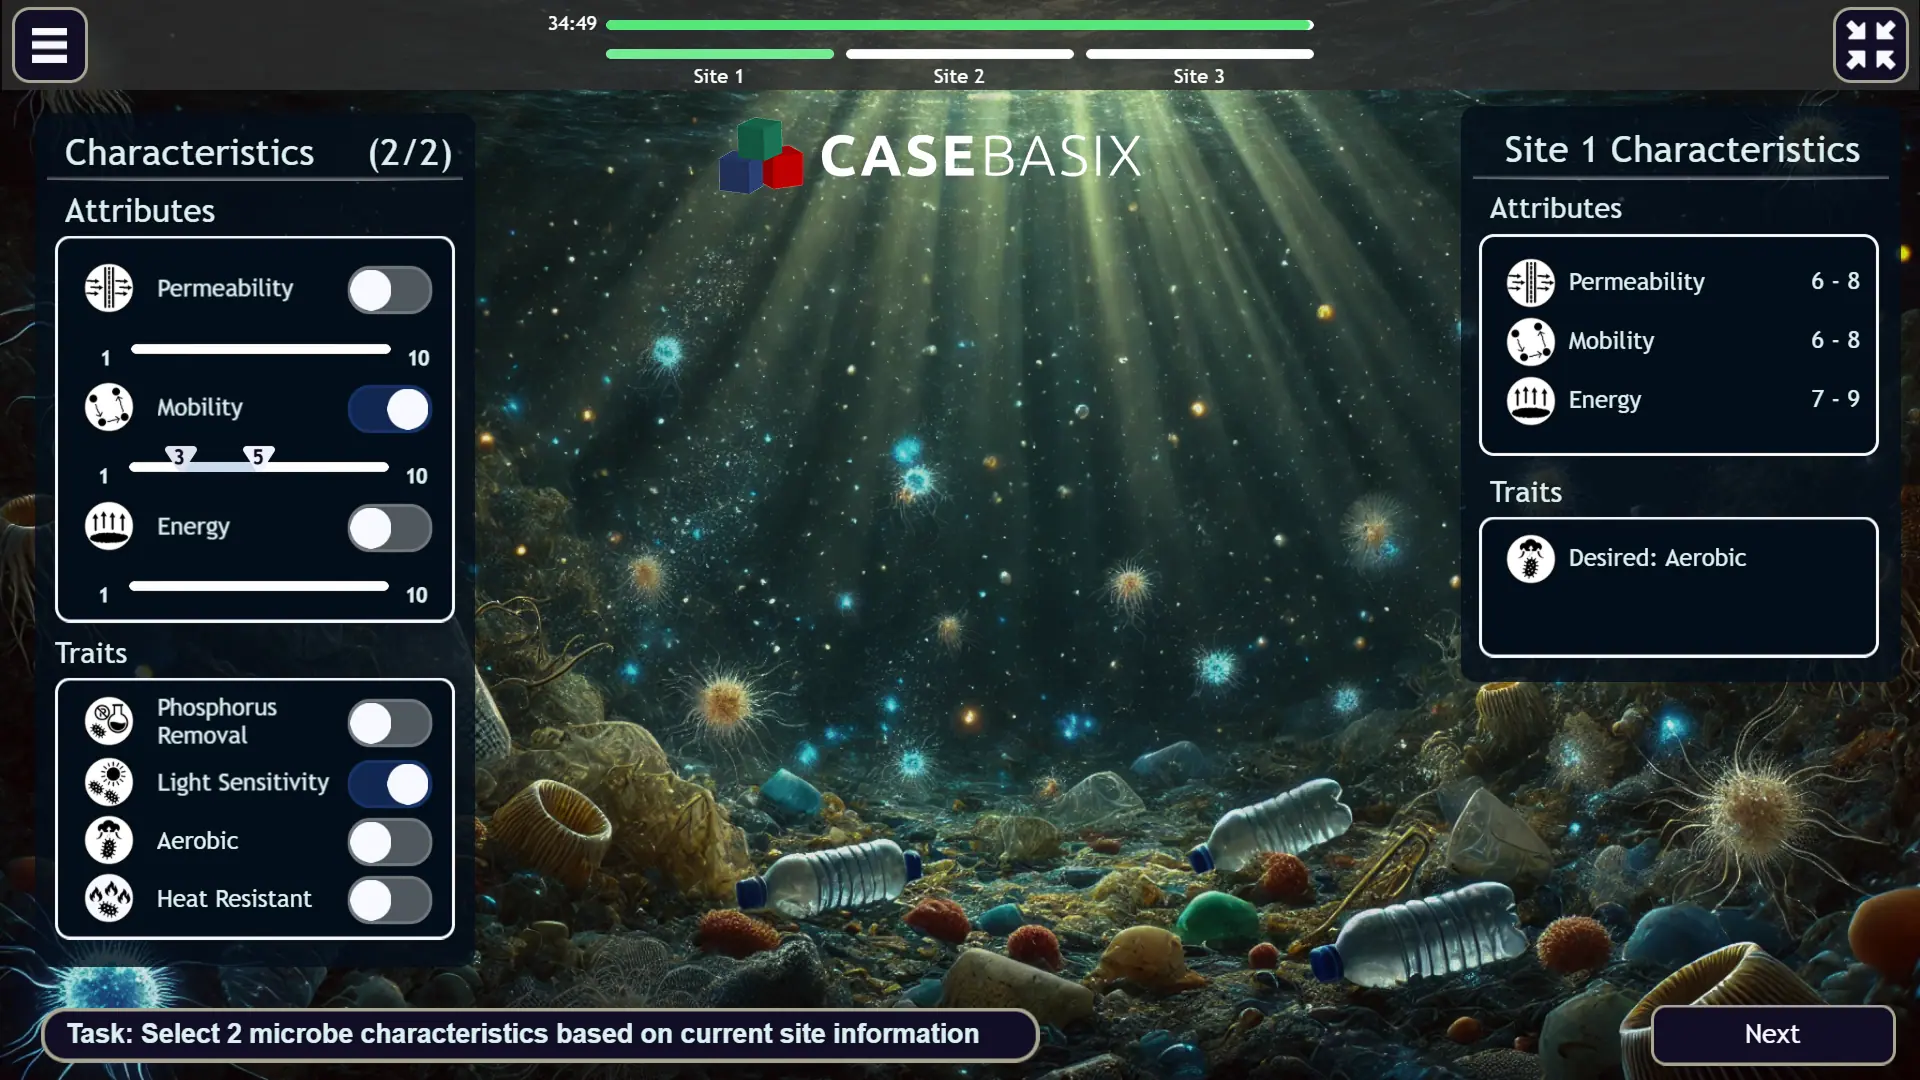
Figure: Step 1 interface in the McKinsey Solve Game’s Sea Wolf module showing Site 1’s target attributes and desired trait, along with the microbe characteristic selection panel.
3. Microbes
Each microbe in the game comes with:
- Three numerical attributes
- One binary trait
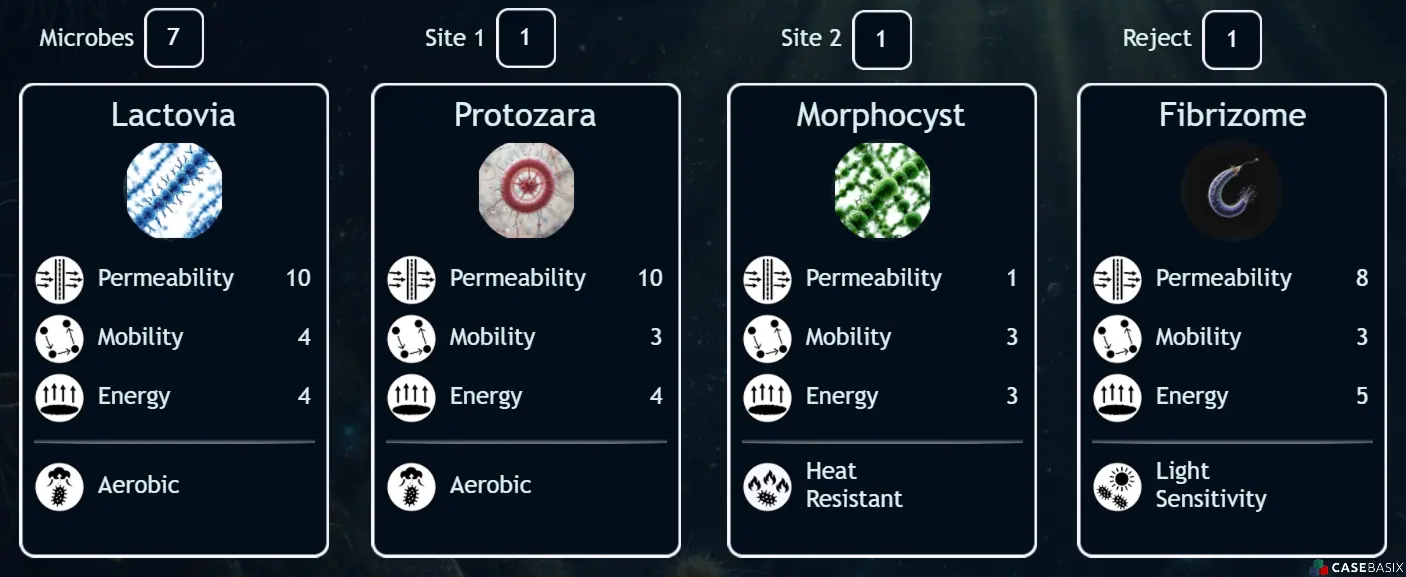
Figure: Microbe selection interface in the Sea Wolf Game, part of the McKinsey Solve assessment, where players match traits to Site 1, Site 2, or reject options.
4. Gameplay Elements:
- Microbe Database: This is the complete collection of microbes from which candidates are drawn.
- Prospect Pool: At the beginning of each round, you're given a selection of 10 microbes randomly drawn from the database to choose from.
- Treatment Microbes: You will assign a final set of 3 microbes from the pool to a site.
5. Scoring Breakdown:
The success of your treatment is based on the average attributes and collective traits of the three selected microbes, evaluated against the site’s requirements.
Treatment effectiveness is scored out of 100%, based on how well the microbes meet the site’s conditions:
- 60%: Each of the three attribute averages falls within the site’s required range (20% per attribute)
- 20%: At least one microbe has the desired trait
- 20%: None of the microbes have the undesirable trait
Note: A perfect score of 100% may not always be possible, depending on the microbes provided.
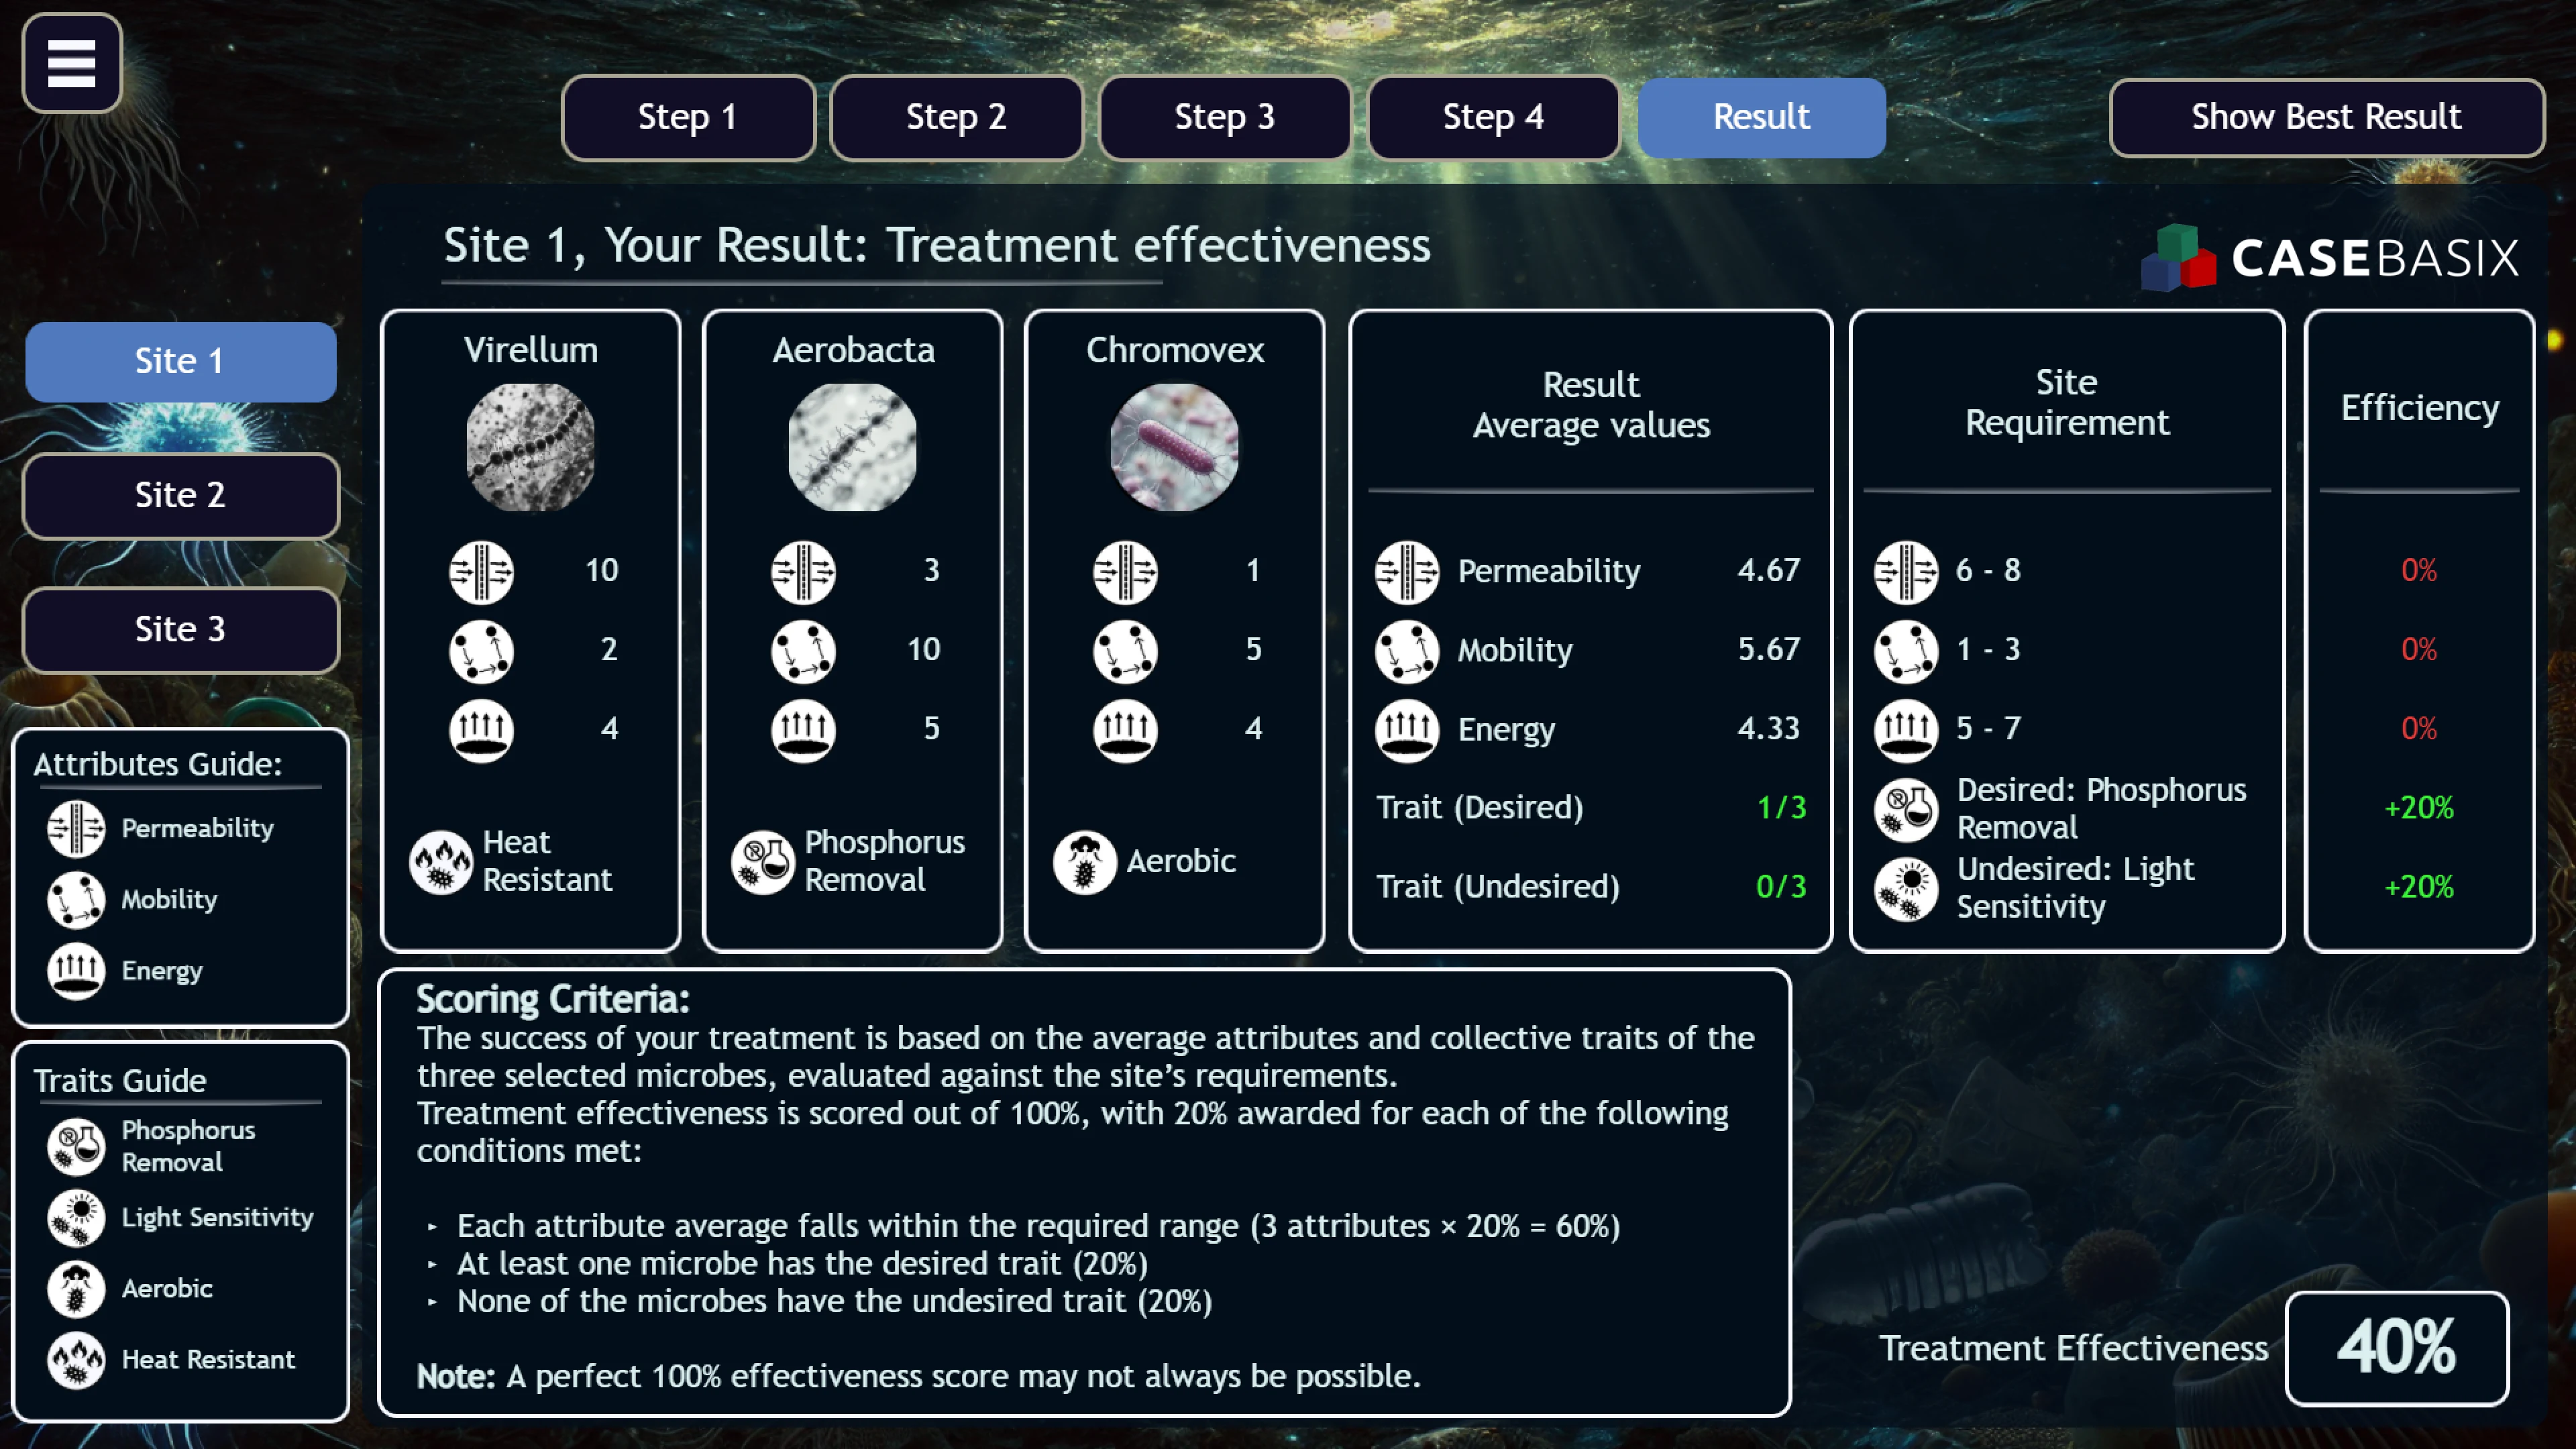
Figure: Treatment result screen from CaseBasix’s Sea Wolf simulation for the McKinsey Problem Solving Game, showing 40% treatment effectiveness for Site 1.
How to play the Sea Wolf Game in the McKinsey Solve assessment?
In this game, you will follow four main steps to select the final three microbes for each ocean site.
Below, we will walk through each step in detail and share practical tips and strategies to help you approach the game.
Step 1: Define Characteristics Selection Criteria for Microbes
At the beginning of each round, you will select two characteristics, either attributes or traits, to filter the microbes.
- If you select an attribute, you will define a numeric range of 2 values (for example, 6 to 8).
- If you select a trait, you will toggle on the trait you want to include.
These filters help generate the initial pool of microbes but do not impact your final selection in later steps.
This is Step 1 of the McKinsey Solve Sea Wolf game, showing how attribute and trait filters are defined.
Tips for defining criteria:
Choose one attribute and one trait when setting your filters:
- Select an attribute with a low or high target range (further from the midpoint value of 5.5). This makes it easier to eliminate microbes that fall outside the range.
- Choose a trait that is either desirable or undesirable, depending on what is provided in the site’s characteristics. If both are given, prioritize the desirable trait, as it increases your chances of scoring points by including it in at least one selected microbe.
This strategy helps you narrow down the pool more effectively and aligns with McKinsey’s problem-solving approach of setting focused, early-stage filters.
Step 2: Assign or Reject Microbes
After applying your initial filters, you will receive a prospect pool of 10 microbes. Each microbe is defined by three numerical attributes (such as permeability, mobility, and energy) and one unique trait.
Your task is to evaluate each microbe and decide whether to assign it to the current site, the next site, or reject it. Repeat this process for all 10 microbes. Use the site information provided on the screen to guide your decisions.
Tips for assigning microbes:
A microbe is considered a suitable match for a site if:
- At least two out of three attributes fall within the site’s required ranges
- It contains the desired trait
- It does not contain the undesirable trait
If a microbe does not meet the criteria for either site, reject it.
Keep in mind that perfect matches may not always be available. Use your judgment to assign the best possible fit. Prioritize microbes that meet more of the site's criteria—especially avoiding those with the undesirable trait.
Step 3: Select Microbes to Build Prospect Pool
In this step, you will begin with a pre-selected set of microbes. Alongside that, you will be shown a rotating set of three new microbes. From each new set, select one microbe to add to your pool. This process continues until your prospect pool contains a total of 10 microbes.
Same as step 2, each microbe is displayed with:
- Three numerical attributes (e.g., permeability, mobility, energy)
- One trait, which may be desirable, undesirable, or neutral based on the site’s conditions
Tips for selecting microbes:
- Avoid microbes that have the site’s undesirable trait
- Prioritize microbes that meet at least two attribute requirements
- If possible, include the desired trait in your selections
- Keep the site’s full set of requirements in mind as you build your pool
Focus on assembling a pool that gives you strong options to form a high-scoring treatment team in the next step.
Step 4: Finalize the 3 Microbes for Site Treatment
In the final step, your task is to select three microbes from your 10-microbe pool to form the treatment team for the current site.
The objective is to maximize your treatment effectiveness score, which is calculated out of 100%. Each microbe’s attributes and trait should be carefully evaluated to make the best possible selection.
Tips for effective selection:
- Choose microbes whose average attribute values fall within the site’s required ranges
- Avoid any microbe that contains the undesirable trait
- Ensure that at least one microbe has the desired trait
- If a perfect match isn’t possible, select the combination that gets you closest to full score
Refer to the Score Breakdown section above for details on how points are awarded.
Once you have made your selection, the game will move on to the next ocean site. You’ll repeat this step for each of the three sites.
Additional Tip: Have a pen, paper, and calculator ready. While Excel can help, the math involved is straightforward enough that manual calculations usually work just fine.
Ecosystem Building
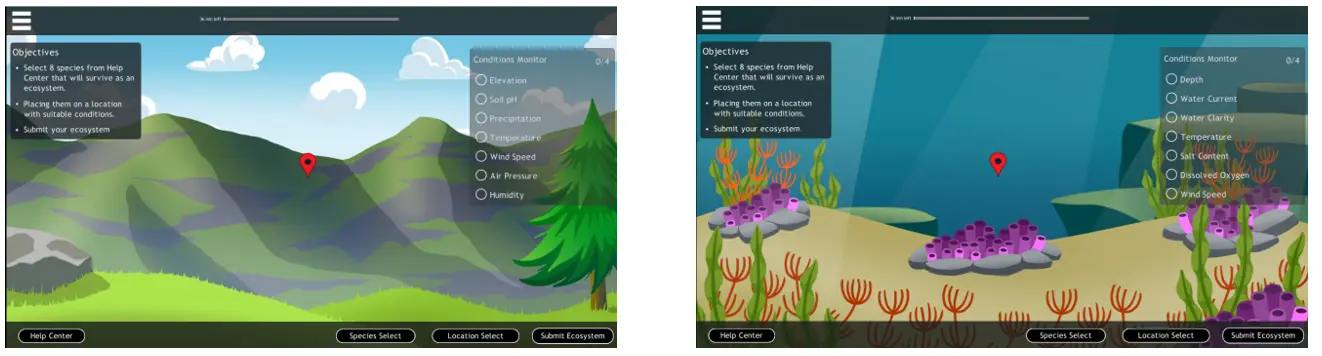
Figure: Mountain (Left) & Reef (Right) Scenario of Ecosystem Building Game
What is Ecosystem Building Game?
This is a 35-minute time limit game. You will be placed randomly into either a mountain or a reef scenario. (Click here to sign up and play the game for FREE!)
Objective:
Your goal is to construct an ecosystem comprising 8 species from a selection of 39. There are three primary objectives to accomplish:
- The ecosystem should establish a continuous food chain.
- Ensure a calorie surplus for each predator-prey pair.
- Align the ecosystem with the terrain specifications of your chosen location
What does Ecosystem Building Game include?
1. Terrain Specifications
Each location within the ecosystem is characterized by seven to eight terrain specifications, which can be selected by pinpointing a location.
In the Mountain scenario, there are 8 terrain specifications: Elevation, Soil pH, Precipitation, Temperature, Wind Speed, Air Pressure, Humidity, and Cloud Height.
In the Reef scenario, you'll find 7 terrain specifications: Depth, Water Current, Water Clarity, Temperature, Salt Content, Dissolved Oxygen, and Wind Speed.
Each species has its own set of required terrain specifications, typically ranging from two to four. Failure to meet these terrain requirements will result in the species dying out. These requirements often come in ranges.
2. Food Chain Continuity
In the game, you will be given a total of 39 species, categorized into two main types: producers and consumers.
- Producers: These include plants and corals. Their sole source of food is typically sunlight or other natural elements. Consequently, they neither have prey nor consume calories.
- Consumers: This category comprises animals, which can further be classified as Herbivores (plant-eating animals), Carnivores (animal-eating animals), or Omnivores (consumers of both plants and animals). Additionally, some consumers hold the status of "apex animals," indicating that they do not have natural predators and are not consumed by any other species within the ecosystem.
3. Calories Balance
Each species in the ecosystem is characterized by two essential figures: Calories Needed and Calories Provided.
A species can thrive under the following conditions:
- Sufficient Energy for Survival: The species' calorie needed is lower than the total calorie provided by the ecosystem.
- Avoiding Extinction by Predation: The species' calorie provided surpasses the combined calorie consumption by the species that prey upon it.
In essence, for a species to thrive, it must have enough energy to sustain itself and should not be consumed to the point of extinction by its predators.
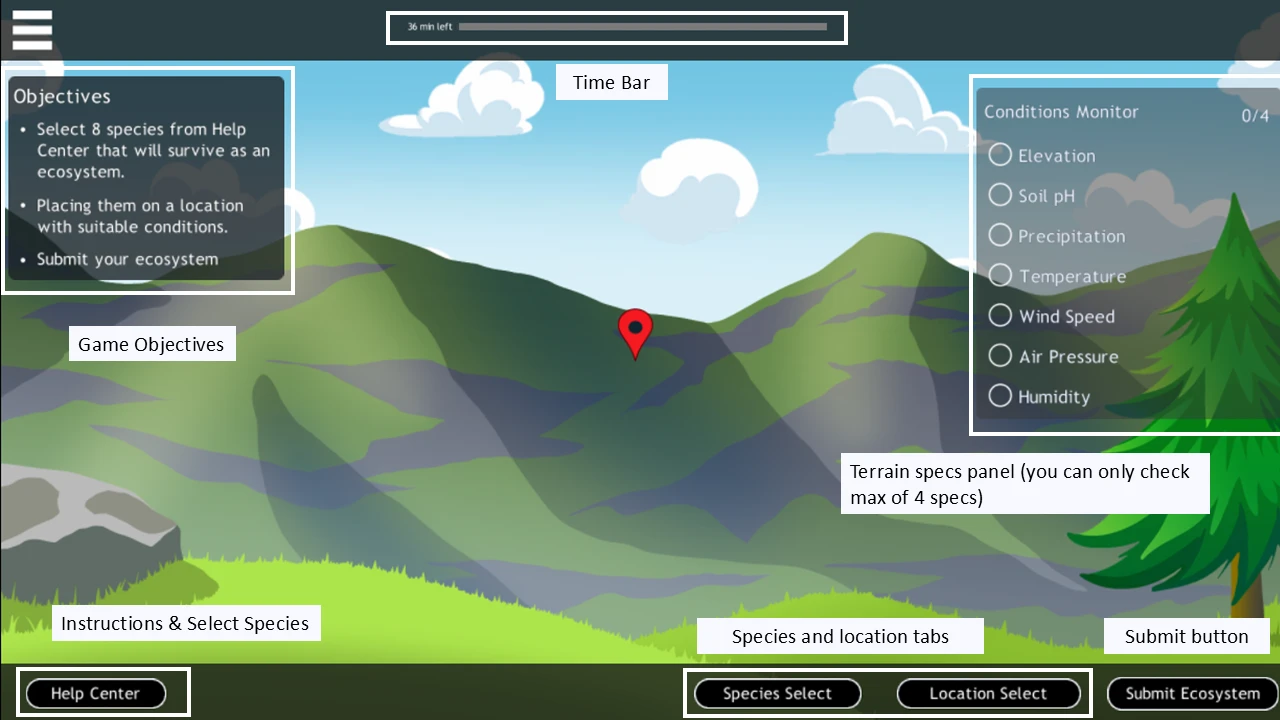
Figure: Interface overview of the Ecosystem Building module in the McKinsey Solve Game, showing key UI elements for terrain, species, and conditions.
Main Challenges of Ecosystem Building Game:
- Information Overload: Handling a significant amount of data that requires absorption, calculation, analysis, and prioritization. This encompasses the specifications of 39 species, terrain characteristics of each location, and dietary rules.
- Distracting and Irrelevant Information: Certain details provided may not be relevant and are included to divert your attention or lead you into making assumptions. It's essential to refrain from making any guesses or relying on any prior knowledge related to the environment, ecology, or zoology
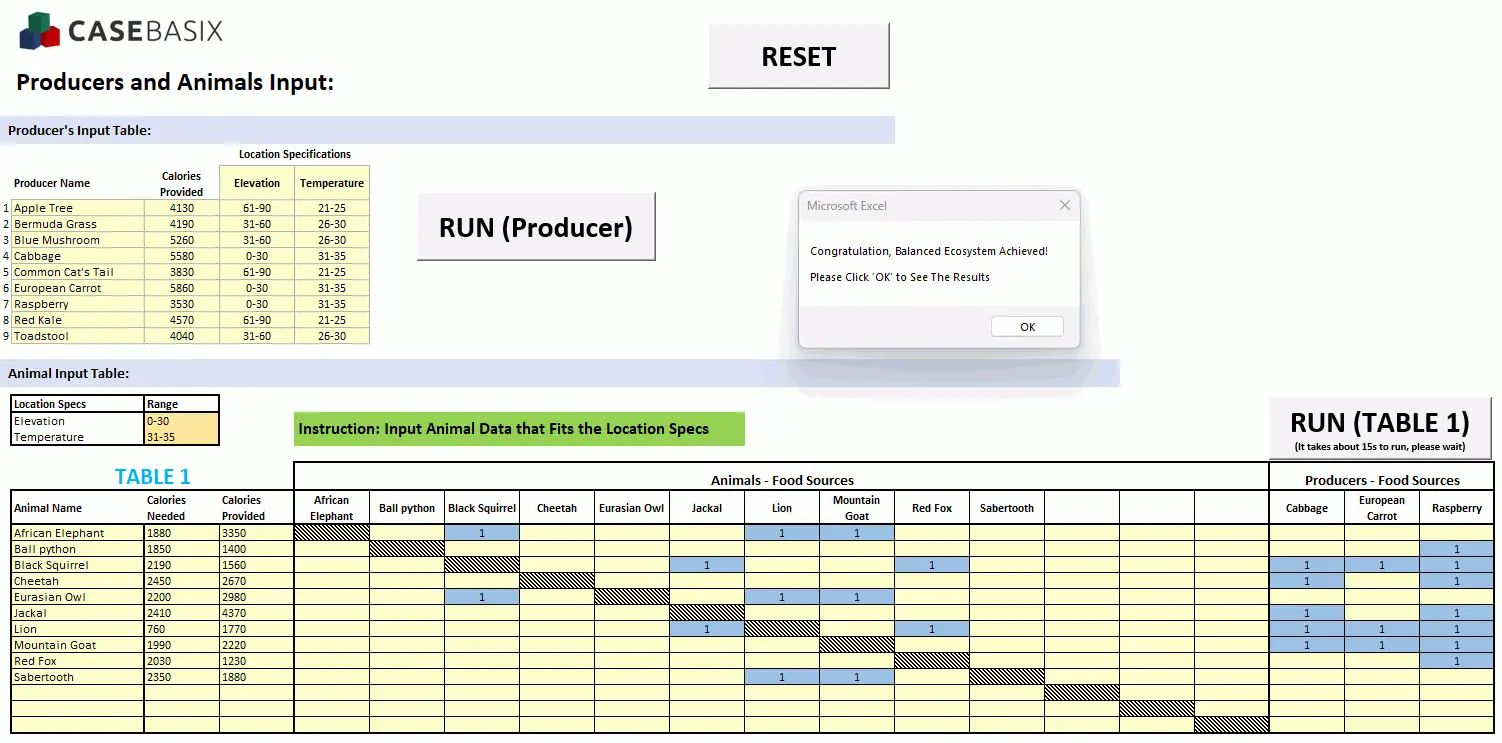
Figure: CaseBasix Ecosystem Building Excel Solver
How to tackle Ecosystem Building Game:
Here's a breakdown of how to approach the game, following a 3-step process:
Step 1: Location Selection
- Use a spreadsheet or scratch paper to record the terrain specifications and calorie provided data for the mini-game's producers.
- Examine the data to identify which terrain specifications remain consistent across all species and which ones change. Focus only on the changing terrain specifications (usually 2 of them), while the others are intended to divert your attention.
- Calculate the total calories provided for the producers in each group of terrain specifications. The group with the highest calorie provision is likely the easiest to construct the food chain.
Step 2: Food Chain Building
- Examine the data to list consumers with compatible terrain requirements in your spreadsheet.
- Select the apex predator with the lowest calorie requirement as the starting point for the food chain.
- Construct the food chain starting from the apex predators and work your way down, listing the food sources for each top-level predator. Keep progressing in this manner until you reach the lowest tier, which includes corals and plants. Ideally, the food chain should encompass 3-4 levels and encompass 8 species.
- Alternatively, you can build the food chain from the bottom up by examining the "Eaten By" specifications of each species, working your way up to the top predators.
- Throughout the process, prioritize species with high calorie provision and low-calorie requirement. This should increase the chances of a calorie surplus in the food chain and allow room for additional species if the initial chain falls short of the required 8 species.
- If your food chain doesn't reach the necessary 8 species, work from the bottom up to identify gaps of unused surplus calories and fill these gaps with predators or plant-eating animals.
Step 3: Sanity Check
- Ensure that each species in your food chain aligns with the chosen location.
- Verify that the food chain is continuous, meaning that the listed food sources match the descriptions of each species.
- Confirm that each species in the food chain has an adequate calorie supply and isn't consumed to extinction based on the provided eating rules.
- If any of the three checks are not met, make adjustments to the food chain.
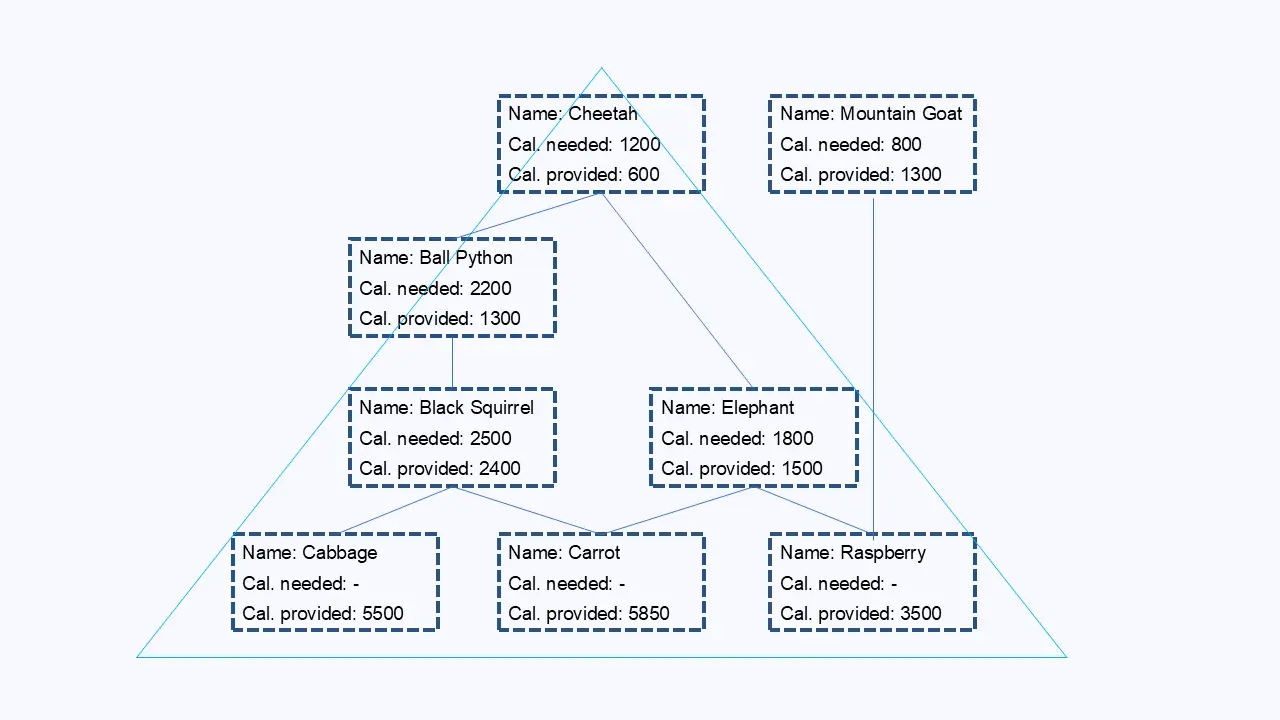
Figure: Illustration of a food chain in Ecosystem Building game
Why Practice the McKinsey Problem Solving Game?
The McKinsey Solve Game is meant to assess your critical thinking skills. However, if you haven't practiced beforehand, you might not be familiar with these mini-games, including how they work and what you're supposed to do.
According to our survey, many candidates were surprised when they took the test, even if they had read guides and watched game walkthroughs. These mini-games have complicated interfaces and various functions. Most candidates, when they first encounter them, need to spend time just figuring out how they work, then what the goals are, and finally start playing the game. Going through all these steps in a very short time can be nearly impossible.
You might have the exact set of thinking skills McKinsey is looking for and still not do well in the mini-game. Practicing helps bridge the gap between those skills and the structured problem-solving expected when working at McKinsey. This could happen because you might not understand how the game works, struggle with time management, or get confused by some aspects of the game.
That's why practicing with the McKinsey Game is so helpful. With our FREE McKinsey PSG Simulation, you can become familiar with these types of mini-games and improve the thinking skills you need to do well.
Frequently Asked Questions About McKinsey Digital Assessment
Q1: Is McKinsey Solve Game the same as Imbellus Game?
A: Yes. It is also known as the Imbellus Game, McKinsey Digital Assessment, or Problem Solving Game (PSG). These terms are used interchangeably by candidates and recruiters.
Q2. Does the McKinsey Assessment Game differ for U.S. applicants?
A: No, the game format is consistent across all global offices. However, the level of competition can be especially intense in top-tier U.S. locations like New York and San Francisco, where the game often screens thousands of applicants per cycle.
Q3: How long is the McKinsey Game?
A: The total duration is approximately 110 minutes, including time for three mini-games. This does not include tutorial time.
Q4: Can I practice the McKinsey PSG for free?
A: Yes. You can try a free McKinsey PSG simulation at CaseBasix to get familiar with the interface, game flow, and strategies.
Q5: What are the 3 games in the McKinsey Solve Test?
A: As of 2026, the assessment includes Ecosystem Building, Red Rock Study, and Sea Wolf (Also known as Ocean Cleanup).
Q6: Can you fail the McKinsey Problem Solving Game?
A: Yes. Around 85% of candidates do not pass the Solve Game. If your performance doesn’t demonstrate strong problem-solving, critical thinking, and decision-making skills, you may not receive an interview invitation. McKinsey uses the game to screen for candidates who match the consultant profile.
Q7: How hard is the McKinsey Digital Assessment?
A: The difficulty of the McKinsey Game ranges from moderate to high. The recent addition of the Sea Wolf game has increased the overall challenge. While the games don’t require business knowledge, they assess cognitive skills under time pressure. Many candidates find the Ecosystem and Red Rock games especially difficult without prior preparation.