The BCG Matrix is one of the most widely used tools in strategic management, helping businesses evaluate their product portfolios and make smarter investment decisions. Also known as the BCG portfolio matrix or Growth-Share Matrix, this framework analyzes products and business units based on relative market share and market growth rate. By highlighting which areas are Stars, Cash Cows, Question Marks, or Dogs, it guides leaders on where to invest, develop, or divest. In this article, we will explore what the BCG Matrix is, how it works, and how you can apply BCG Matrix analysis to improve portfolio strategy decisions.
TL;DR – What You Need to Know
The BCG Matrix is a strategic management tool that helps businesses evaluate product portfolios and allocate resources based on market growth and relative market share.
- The BCG Matrix classifies products into Stars, Cash Cows, Question Marks, and Dogs to guide strategic investment and divestment decisions.
- Market growth rate and relative market share are the two core dimensions defining product positioning in the BCG Matrix.
- Creating a BCG Matrix involves identifying products, calculating market data, and placing each in the correct quadrant for strategy planning.
- Strategic implications vary by quadrant - Stars need investment, Cash Cows fund others, Question Marks need assessment, and Dogs often face divestment.
- Integrating the BCG Matrix with tools like SWOT and Porter’s Five Forces enhances portfolio optimization and long-term strategy development.
Table of Contents:
- What Are the Components of the BCG Matrix Analysis?
- How to Create a BCG Matrix Analysis
- What Are the Strategic Implications in BCG Matrix Analysis?
- What Are Applications of the BCG Portfolio Matrix?
- Advantages and Limitations of the BCG Matrix Analysis
- How to Integrate the BCG Matrix Analysis into Strategy
- Key Takeaways from the BCG Matrix Analysis
- Frequently Asked Questions
What Are the Components of the BCG Matrix Analysis?
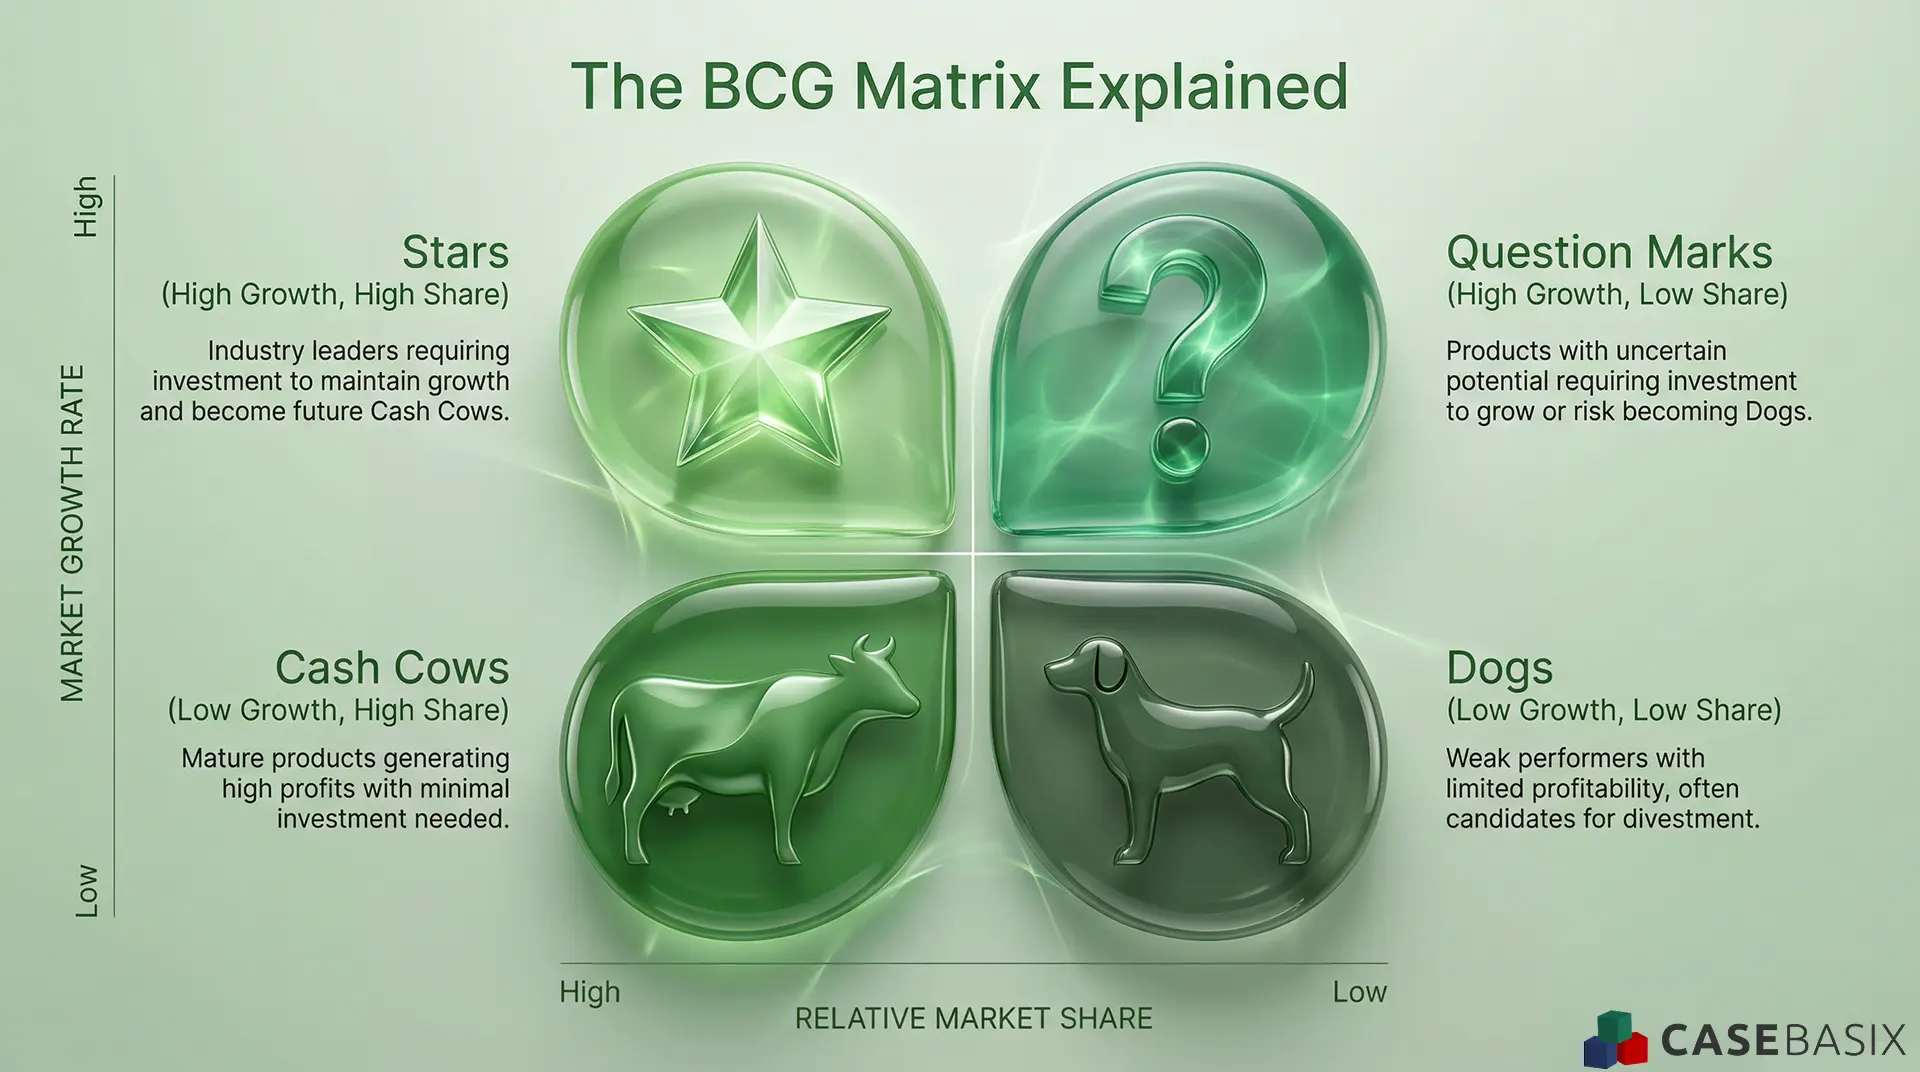
This infographic shows how products are categorized into Stars, Cash Cows, Question Marks, and Dogs based on market growth and relative market share.
This visual clarifies how the BCG Matrix evaluates products using market growth and relative market share to guide strategic decisions. By understanding the four quadrants, businesses can better assess which areas require investment, optimization, or divestment. The graphic reinforces how portfolio analysis supports long-term resource planning.
The BCG Matrix is built on two key dimensions, Market Growth Rate and Relative Market Share, which define the four quadrants of the model. Understanding these components is essential for effectively analyzing a business portfolio.
1. Market Growth Rate
This refers to how fast the market for a specific product or business unit is expanding. A higher market growth rate indicates strong industry demand, while a lower rate suggests market saturation or decline.
- High growth markets often require substantial investment to maintain or expand market presence.
- Low growth markets provide limited opportunities for scaling but can still generate stable revenue.
2. Relative Market Share
This measures a company's competitive position in relation to its largest rival. A higher market share generally means greater industry influence and economies of scale.
- A high relative market share suggests a strong competitive advantage, pricing power, and cost efficiency.
- A low relative market share indicates weaker positioning, requiring aggressive marketing or strategic shifts to gain traction.
3. Four Quadrants of the BCG Matrix
The intersection of market growth rate and relative market share results in four distinct categories, each requiring a unique business strategy.
- Stars (High Growth, High Market Share)
- Leaders in fast-growing industries.
- Require continuous investment to sustain growth.
- Have the potential to become future Cash Cows.
- Cash Cows (Low Growth, High Market Share)
- Mature products with steady revenue streams.
- Require minimal investment while generating high profits.
- Often fund new business opportunities.
- Question Marks (High Growth, Low Market Share)
- Emerging products with uncertain potential.
- Require a significant investment to compete.
- Can either grow into Stars or decline into Dogs.
- Dogs (Low Growth, Low Market Share)
- Weak market performers with limited profitability.
- May be phased out or repositioned.
- Often considered for divestment.
4. Strategic Implications of the BCG Matrix
Understanding these components allows businesses to:
- Prioritize investments based on a product's market position.
- Diversify portfolios to balance risk and profitability.
- Identify opportunities for expansion or exit strategies.
- Optimize resource allocation to maximize long-term growth.
By leveraging the BCG Matrix effectively, companies can align their business strategies with market dynamics and enhance competitive positioning in their industry.
How to Create a BCG Matrix Analysis
Building a BCG Matrix involves a structured approach that allows businesses to classify their products or business units based on market performance. Below is a step-by-step guide to constructing an accurate and effective BCG Matrix.
1. Identify the Business Units or Products
- List all business units, products, or services within the company’s portfolio.
- Each unit should be analyzed separately rather than considering the entire company.
2. Determine the Market Growth Rate
- Calculate the industry growth rate for each product segment.
- Use market reports, industry data, or government statistics for accuracy.
- Compare it against a standard benchmark (e.g., the average industry growth rate).
- A general rule:
- Above 10% growth → High market growth
- Below 10% growth → Low market growth
3. Calculate the Relative Market Share
- Determine the market share of each product or business unit.
- Compare it to the market share of the largest competitor in the same category.
- Formula:
Relative Market Share = Company’s Market Share / Largest Competitor’s Market Share - If the value is greater than 1, it indicates market dominance.
- If the value is less than 1, it suggests a weaker competitive position.
4. Plot the Data on a BCG Matrix Grid
- Draw a 2x2 matrix with:
- X-axis (Horizontal) → Relative Market Share (High to Low)
- Y-axis (Vertical) → Market Growth Rate (High to Low)
- Place each product or business unit in one of the four quadrants:
- Stars (High Market Share, High Growth)
- Cash Cows (High Market Share, Low Growth)
- Question Marks (Low Market Share, High Growth)
- Dogs (Low Market Share, Low Growth)
5. Analyze and Interpret the Matrix
Once the business units are placed in the matrix, evaluate their strategic positioning and future actions:
- Stars → Continue investing for growth and market leadership.
- Cash Cows → Maintain and utilize profits to fund other segments.
- Question Marks → Decide whether to invest heavily or divest.
- Dogs → Consider repositioning, selling, or phasing out.
6. Develop Strategic Decisions Based on Findings
- Allocate resources based on where each unit fits in the BCG Matrix.
- Focus on growth strategies for Stars and Question Marks.
- Extract profits from Cash Cows to fund other opportunities.
- Minimize or eliminate investment in Dogs unless they serve a strategic purpose.
By following these steps, businesses can effectively utilize the BCG Matrix to enhance decision-making, prioritize investments, and optimize resource allocation.
Kickstart Your Consulting Prep Journey?
Click the image below to get your free Consulting Starter Pack
.png)
What Are the Strategic Implications in BCG Matrix Analysis?
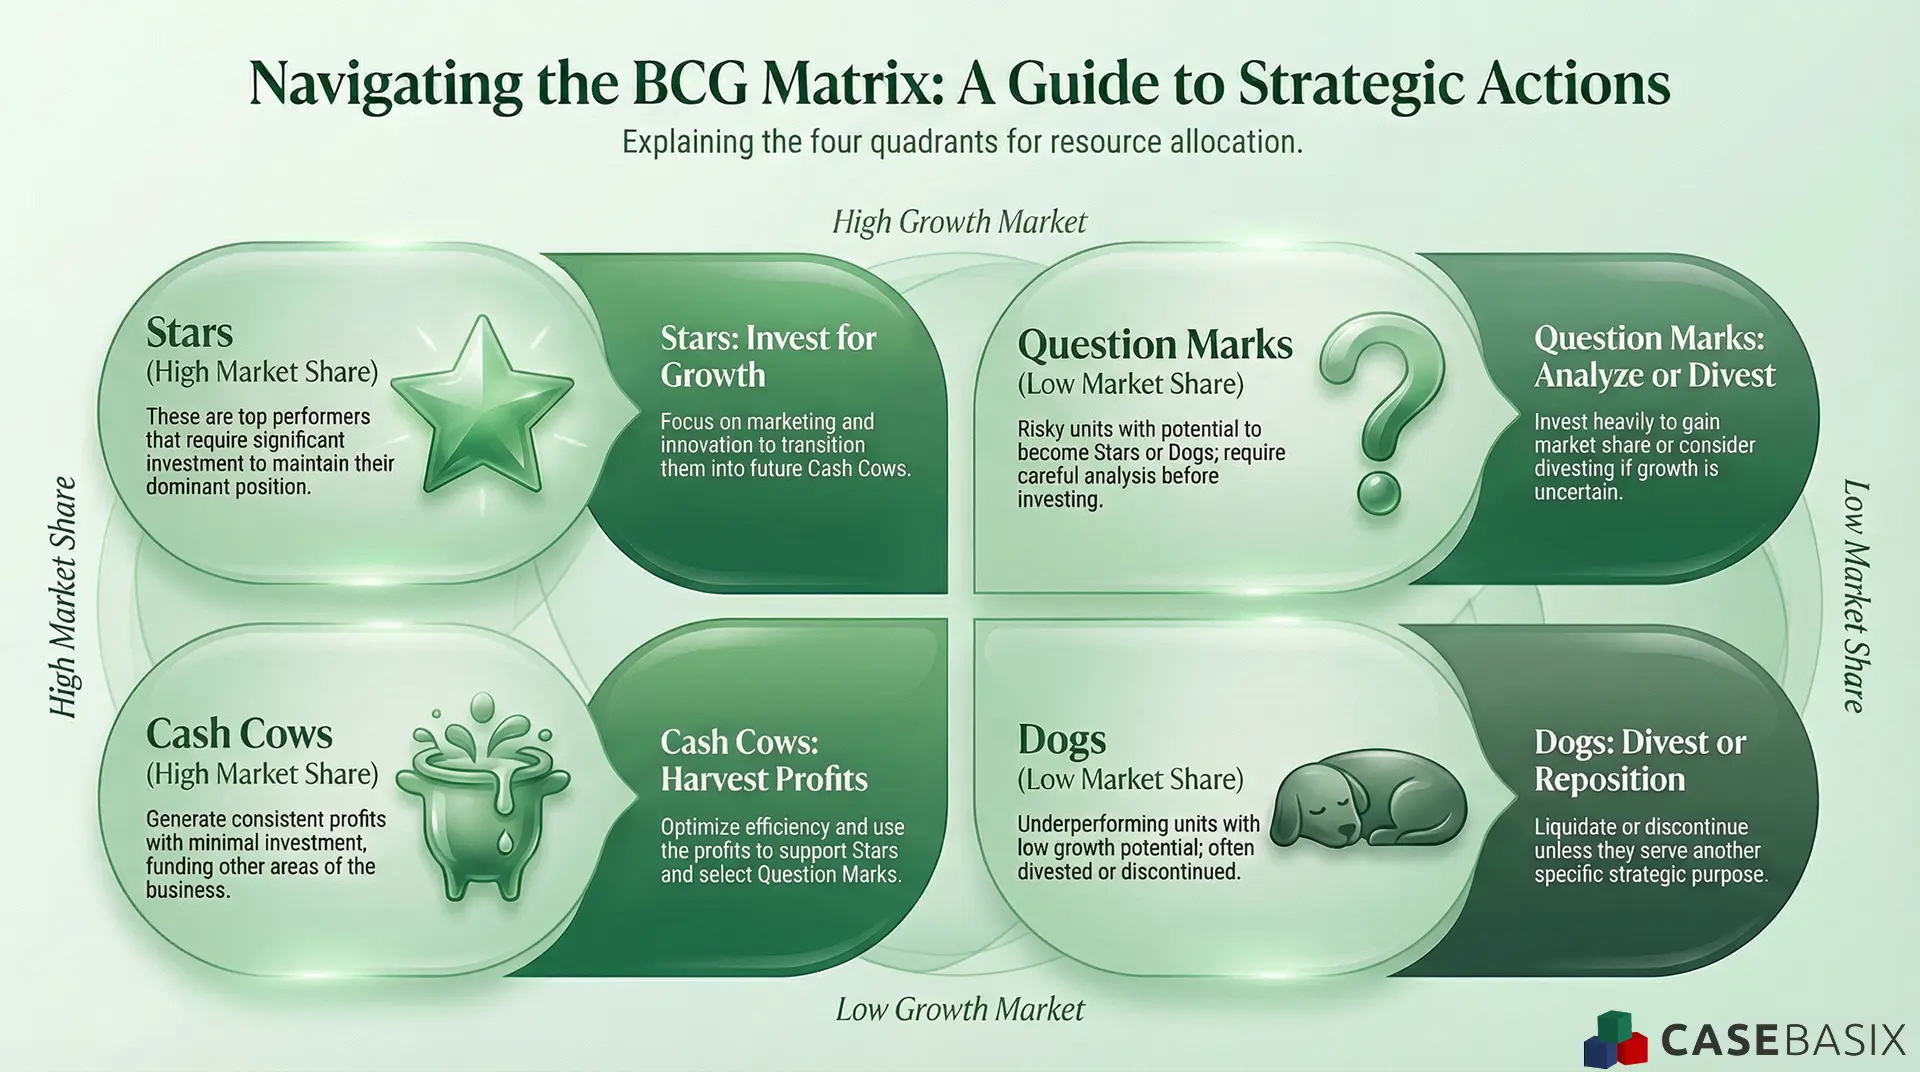
This infographic outlines recommended strategic actions for Stars, Cash Cows, Question Marks, and Dogs based on growth conditions and market share.
This visual highlights how each quadrant in the BCG Matrix aligns with specific strategic actions depending on growth conditions and market share strength. By reviewing the guidance for Stars, Cash Cows, Question Marks, and Dogs, readers can better understand how companies allocate resources across their portfolios. The graphic reinforces how strategic choices vary based on performance potential and market dynamics.
Understanding the strategic implications of each quadrant in the BCG Matrix helps businesses make informed decisions regarding resource allocation, investment, and long-term planning. Each category, Stars, Cash Cows, Question Marks, and Dogs, requires a distinct approach to maximize profitability and sustain market competitiveness.
1. Stars (High Market Share, High Growth)
Implications:
- Represent the best-performing products or business units in growing markets.
- Require significant investment to sustain growth and retain market dominance.
- Have the potential to become Cash Cows once market growth stabilizes.
Strategic Actions:
- Continue investing in marketing, innovation, and expansion.
- Focus on competitive positioning to maintain leadership.
- Monitor industry growth trends to anticipate when they may transition to Cash Cows.
2. Cash Cows (High Market Share, Low Growth)
Implications:
- Generate consistent profits with minimal investment.
- Serve as the financial backbone of a company, funding other business units.
- Typically operate in mature or saturated markets with limited growth opportunities.
Strategic Actions:
- Optimize operations to maintain efficiency and profitability.
- Use profits to support Stars and Question Marks.
- Consider product diversification or cost-cutting measures if market conditions shift.
3. Question Marks (Low Market Share, High Growth)
Implications:
- Exist in growing industries but lack strong market positioning.
- Require careful evaluation before investing heavily in growth.
- Have the potential to become Stars or decline into Dogs.
Strategic Actions:
- Analyze market potential, competitive landscape, and cost-benefit of further investment.
- Implement aggressive marketing, innovation, or restructuring strategies to improve market share.
- If long-term growth is uncertain, consider divestment or repositioning.
4. Dogs (Low Market Share, Low Growth)
Implications:
- Represent underperforming products in stagnant or declining markets.
- Offer little to no future growth potential.
- Often require more resources than they generate, making them a liability.
Strategic Actions:
- Assess whether they serve any strategic purpose (e.g., brand loyalty, niche markets).
- Consider cost reduction, repositioning, or niche targeting if retention is necessary.
- If unprofitable, pursue divestment, discontinuation, or asset liquidation.
Key Takeaways
- Stars are growth engines that require investment.
- Cash Cows generate profit with low investment needs.
- Question Marks are risky but can turn into Stars or Dogs.
- Dogs often need to be phased out unless they serve a strategic function.
By leveraging these insights, businesses can develop balanced investment strategies, ensuring long-term profitability while adapting to market shifts.
What Are Applications of the BCG Portfolio Matrix?
The BCG Matrix is widely used across industries to guide business strategy, investment decisions, and portfolio management. By examining real-world applications and case studies, companies can better understand how to classify, manage, and prioritize their products or business units.
1. Tech Industry: Apple’s Product Portfolio
Apple’s products fit well into different quadrants of the BCG Matrix:
- Stars: The iPhone, Apple’s flagship product, dominates the smartphone market and continues to grow. Apple heavily invests in R&D and marketing to maintain its competitive edge.
- Cash Cows: The MacBook lineup enjoys a loyal customer base and generates steady revenue, requiring less investment than newer products.
- Question Marks: The Apple Vision Pro (AR/VR headset) is a new entrant in a high-growth market but has yet to prove its dominance.
- Dogs: The iPod, once revolutionary, became obsolete with the rise of smartphones and was discontinued.
2. Fast Food Industry: McDonald's Strategy
McDonald’s uses the BCG Matrix to evaluate its menu items and regional markets:
- Stars: McDonald’s delivery services and digital kiosks are expanding rapidly with strong market share.
- Cash Cows: The Big Mac and McFries are iconic menu items with stable demand and profitability.
- Question Marks: Plant-based burgers and sustainability initiatives are new ventures that need strategic investment to gain market share.
- Dogs: Certain regional menu items or failed experiments (e.g., McPizza) were discontinued due to low performance.
3. Automotive Industry: Tesla’s Business Model
Tesla's portfolio follows the BCG Matrix framework:
- Stars: The Model Y and Model 3 are market leaders in electric vehicle (EV) sales, benefiting from high consumer demand and innovation.
- Cash Cows: The Model S and Model X, though less popular than newer models, generate substantial revenue with minimal R&D costs.
- Question Marks: Tesla's Cybertruck faces competition in the pickup market and requires heavy investment to succeed.
- Dogs: Older versions of Tesla’s models with outdated technology become less relevant and may be phased out.
Advantages and Limitations of the BCG Matrix Analysis
The BCG Matrix is a widely used strategic tool for portfolio analysis and resource allocation, but like any framework, it has both strengths and weaknesses. Understanding these can help businesses use the model effectively while recognizing its limitations.
Advantages of the BCG Matrix
1. Simple and Easy to Use
- The matrix offers a clear visual representation of a company’s product portfolio, making it easy for decision-makers to analyze different business units.
- It requires only two key variables: market growth rate and market share, making data collection straightforward.
2. Helps in Resource Allocation
- Businesses can prioritize funding by investing in Stars and promising Question Marks while limiting resources for Dogs that don’t contribute to long-term growth.
- Ensures efficient budgeting and strategic investment planning.
3. Identifies Growth Opportunities
- The matrix highlights high-growth markets and products that have the potential to become future Cash Cows.
- Helps companies decide where to focus their R&D and marketing efforts.
4. Supports Long-Term Strategic Planning
- Provides a big-picture view of a company’s overall business portfolio.
- Encourages proactive management, helping businesses stay competitive in evolving markets.
Limitations of the BCG Matrix
1. Oversimplifies Market Dynamics
- The model assumes that market share and market growth are the only factors determining success, ignoring external variables such as competition, brand reputation, and customer loyalty.
- High market share does not always mean high profitability, as different industries have varying cost structures and demand patterns.
2. Static and Ignores Market Changes
- The BCG Matrix provides a snapshot in time but does not account for rapid industry shifts, new competitors, or changing consumer preferences.
- Example: Nokia once dominated mobile phones (Cash Cow/Star) but failed to adapt to the smartphone revolution.
3. Limited Use for Niche or Specialized Products
- Some industries (e.g., luxury brands or highly specialized products) do not fit well into the market share vs. market growth model.
- Example: A high-end watch brand with a loyal customer base may have low market share but still be highly profitable.
4. No Consideration for Synergies
- The model treats each business unit or product as separate, but in reality, some products support others.
- Example: Apple’s ecosystem (MacBooks, iPhones, iPads, and services like iCloud) relies on interconnected sales, which the BCG Matrix does not consider.
How to Integrate the BCG Matrix Analysis into Strategy
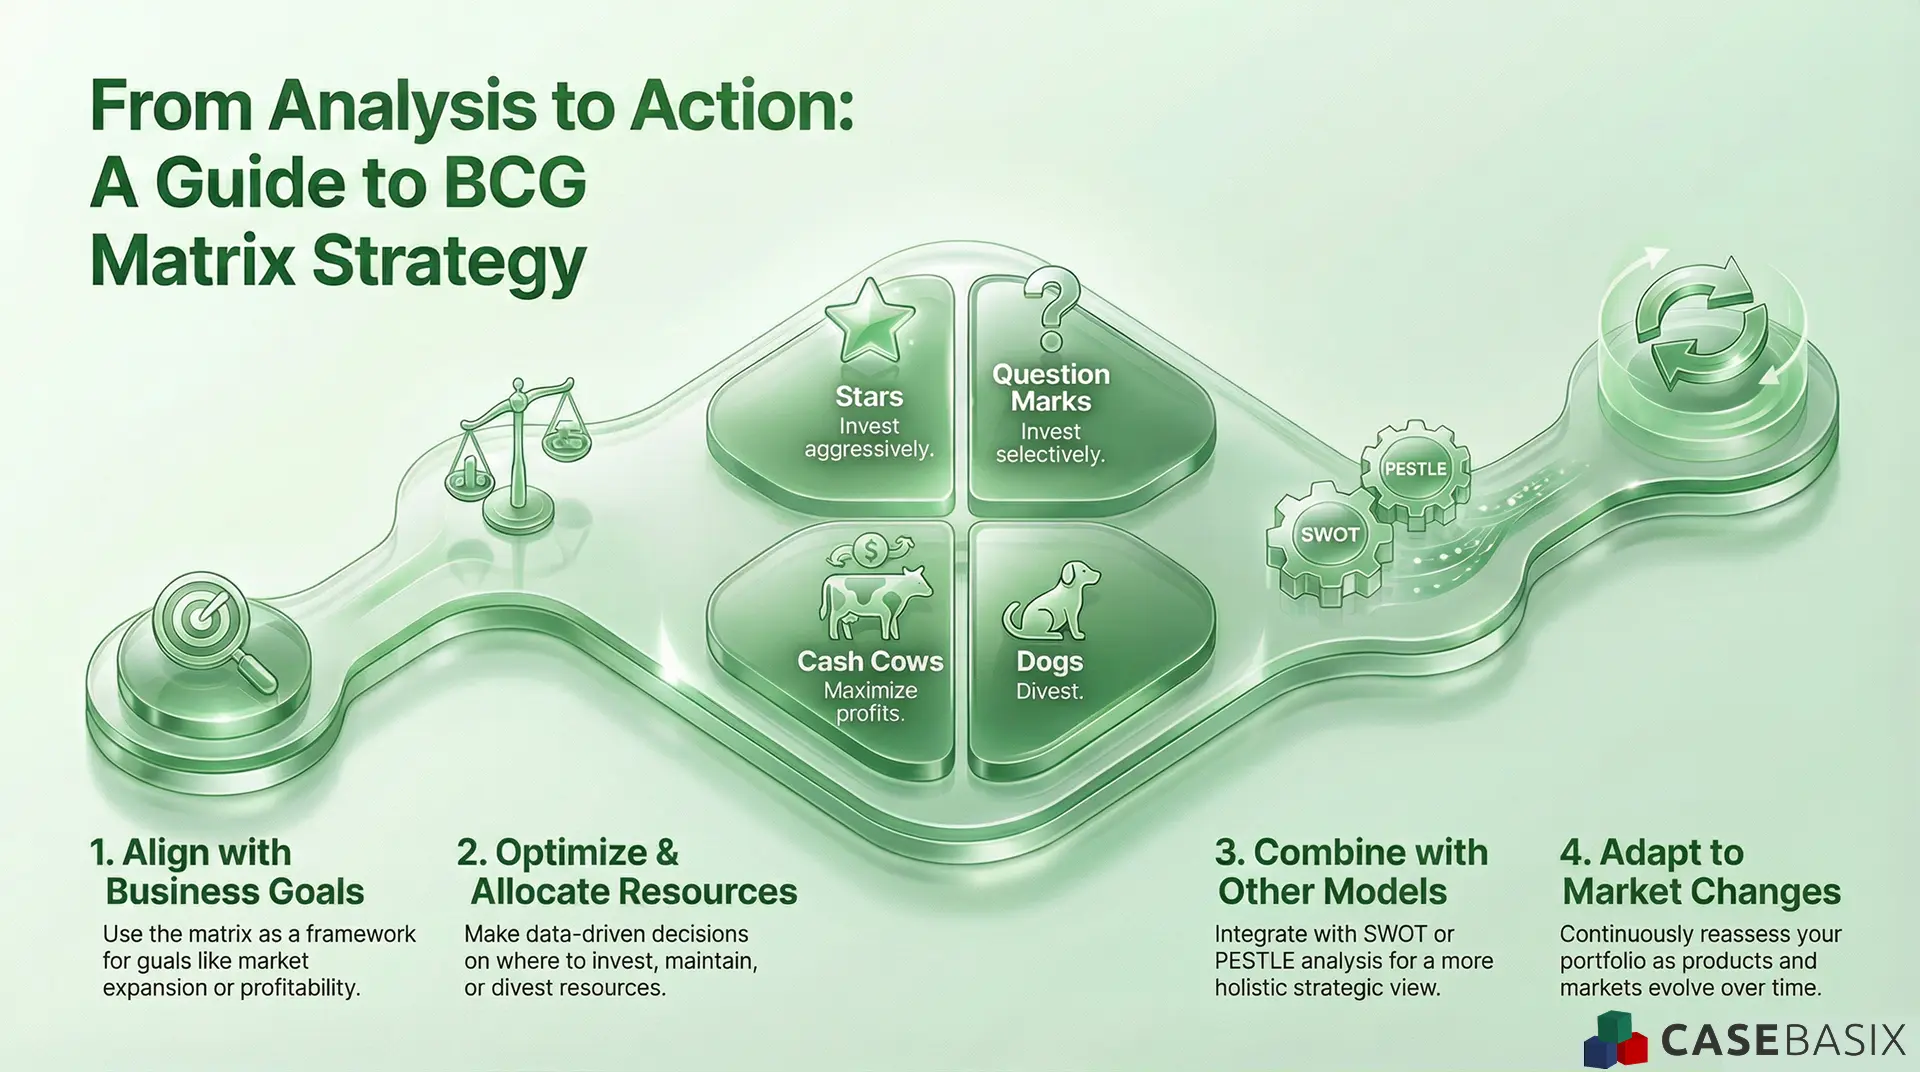
This infographic outlines how businesses apply the BCG Matrix by aligning goals, optimizing resources, integrating models, and adapting to market shifts.
This visual illustrates how companies move from BCG Matrix insights to practical strategy by aligning objectives, allocating resources, and integrating complementary frameworks. It also highlights the importance of adapting decisions as market dynamics evolve. These steps help ensure that portfolio actions remain relevant and forward looking.
The BCG Matrix is not just a theoretical model, it is a practical tool that businesses can integrate into strategic planning to drive informed decision-making. By understanding how to apply the matrix effectively, companies can align resources, optimize investments, and shape long-term strategies for sustainable growth.
1. Aligning the BCG Matrix with Business Goals
- The first step is to align the findings from the BCG Matrix with the company’s overall objectives.
- A business should identify whether it aims for market expansion, profitability, diversification, or consolidation and use the matrix as a guiding framework.
Example
- A tech company aiming for innovation may focus on developing Stars and high-potential Question Marks, while a firm prioritizing profitability might seek to maximize Cash Cows.
2. Portfolio Optimization and Resource Allocation
- The BCG Matrix helps businesses determine where to invest, maintain, or divest resources.
- Star products require high investment but promise future dominance, while Cash Cows provide steady profits that can fund other initiatives.
Strategic Approaches for Each Quadrant
- Stars → Invest aggressively to maintain a competitive edge.
- Cash Cows → Maximize efficiency and use profits to support other ventures.
- Question Marks → Assess potential for market dominance; invest selectively.
- Dogs → Consider repositioning, divesting, or discontinuing.
3. Combining the BCG Matrix with Other Strategic Models
The BCG Matrix should not be used in isolation. Integrating it with other frameworks provides a well-rounded strategic view.
Complementary Models
- SWOT Analysis → Helps assess internal strengths and weaknesses alongside external market opportunities and threats.
- PESTLE Analysis → Evaluates external factors like political, economic, and technological changes that impact market growth.
- Porter’s Five Forces → Analyzes competition and industry dynamics to refine strategic decisions.
Example
- A clothing brand with a Star product in a high-growth market can use Porter’s Five Forces to evaluate competitive threats and adjust pricing or marketing strategies accordingly.
4. Adapting Strategies for Market Changes
- Markets are dynamic, and products do not remain in the same quadrant indefinitely.
- Companies must continuously reassess their product portfolio and shift strategies accordingly.
- A Star today may mature into a Cash Cow, while a declining market could turn a Cash Cow into a Dog.
Example
- Netflix transitioned from a Question Mark (DVD rental) to a Star (streaming services) and then into a Cash Cow (subscription-based streaming leader).
- To stay competitive, Netflix invested in original content to sustain growth as competition increased.
5. Practical Steps for Implementation
To effectively integrate the BCG Matrix into strategic planning, businesses should:
- Gather accurate market data to ensure proper classification of products.
- Regularly update the matrix to reflect market changes and business growth.
- Use insights to make data-driven investment decisions and adjust business strategies.
- Combine with other analytical tools for a holistic business strategy.
Key Takeaways from the BCG Matrix Analysis
The BCG Matrix remains a valuable tool for businesses looking to assess their product portfolio and allocate resources strategically. While it provides a clear framework for decision-making, it should be used alongside other analytical tools to capture the complexities of modern markets. By regularly updating the matrix, aligning it with business goals, and adapting to market shifts, companies can maximize growth opportunities, sustain profitability, and maintain a competitive edge in an ever-evolving business landscape.
Frequently Asked Questions
Q: What is the BCG rule of 4?
A: The BCG rule of 4 refers to the idea that a portfolio should ideally have a balanced mix of all four quadrants of the BCG Matrix: Stars, Cash Cows, Question Marks, and Dogs to support strategic planning and long-term growth.
Q: What is the BCG matrix in pharma marketing?
A: The BCG Matrix in pharma marketing helps companies evaluate their drug portfolios by analyzing products based on market growth rate and relative market share, enabling better investment and resource allocation decisions.
Q: Why is BCG used?
A: The BCG Matrix is used as a business strategy framework to assess product performance, guide investment strategy, and support resource allocation through a clear visual of growth potential and competitive positioning.
Q: What is the BCG rule of three?
A: The BCG rule of three suggests that in most markets, three major competitors will dominate while others struggle, aligning with portfolio analysis insights from the Growth-Share Matrix to guide competitive strategy.
Q: What is the BCG model of economy?
A: The BCG model of economy refers to broader frameworks developed by Boston Consulting Group that analyze macroeconomic trends and business cycles, extending beyond the traditional BCG Growth Matrix into economic and strategic planning.