CaseBasix helped me break down charts, tables and data sets step by step so I wasn’t overwhelmed by data in my case interviews.
Lenny M

Want to master Chart Analysis and land a job at top tier consulting firms?
Don’t wait. Practice NOW. Beat your competition - with CaseBasix.
Free Chart Analysis Practice Questions
Click "Start Practice" to begin the practice
(Play on Desktop, use Google Chrome)
This interactive game is designed for desktop or laptop screens for the best experience.
Chart Analysis Course
Practice 2000+ data/chart problems from 9 different chart types
Detailed answers for each question provide clarity. A state-of-the-art dashboard gives complete results breakdown that helps you understand exactly how you performed. The dashboard includes:
Study with confidence and get you Consulting offer Today!
CaseBasix helped me break down charts, tables and data sets step by step so I wasn’t overwhelmed by data in my case interviews.
Lenny M
Thanks to CaseBasix I learned how to spot key trends in exhibits instead of just reciting numbers.
Brian A
CaseBasix’s chart and data analysis practice made interpreting bar graphs and line charts feel easy and intuitive.
Nick H
CaseBasix showed me how to connect insights from graphs back to the problem statement or the main business problem confidently.
Andrea J
CaseBasix taught me how to stop focusing on every number and instead pull out the real story from the data.
Dan L
Practicing with CaseBasix meant I could read the axes, labels, and trends quickly during live cases.
Alice N
CaseBasix helped me identify anomalies and trends that actually mattered to the interviewer or the case. Else I was rambling.
Amy K
Only through CaseBasix Data Charts course, I could confidently explain “so what” after each chart instead of just describing it.
Joe R
CaseBasix’s drills made pie charts, bubble charts and trend lines second nature when the interviewer asked for analysis.
Glenn T
CaseBasix helped me extract insights that drove the recommendation, not just the numbers.
Diana B
I practiced chart interpretation with CaseBasix and saw immediate improvement in my case interview performance.
Gerry S
CaseBasix taught me how to focus on the most critical data points under time pressure.
Paula W
Thanks to CaseBasix I was able to read complex graphs like a pro and link them to client decisions.
Majed R
CaseBasix helped me communicate insights clearly and concisely after analyzing charts.
Roy D
CaseBasix’s structured practice helped me avoid common data interpretation pitfalls in cases.
Harleen P
With CaseBasix I learned how to compare multiple exhibits and draw strong analytical insights.
Brian S
CaseBasix prep made me more confident tackling tables & P&L analyses in real cases.
Jeff N
CaseBasix helped me turn data interpretation into a strength instead of a stress point during interviews.
Jessica M
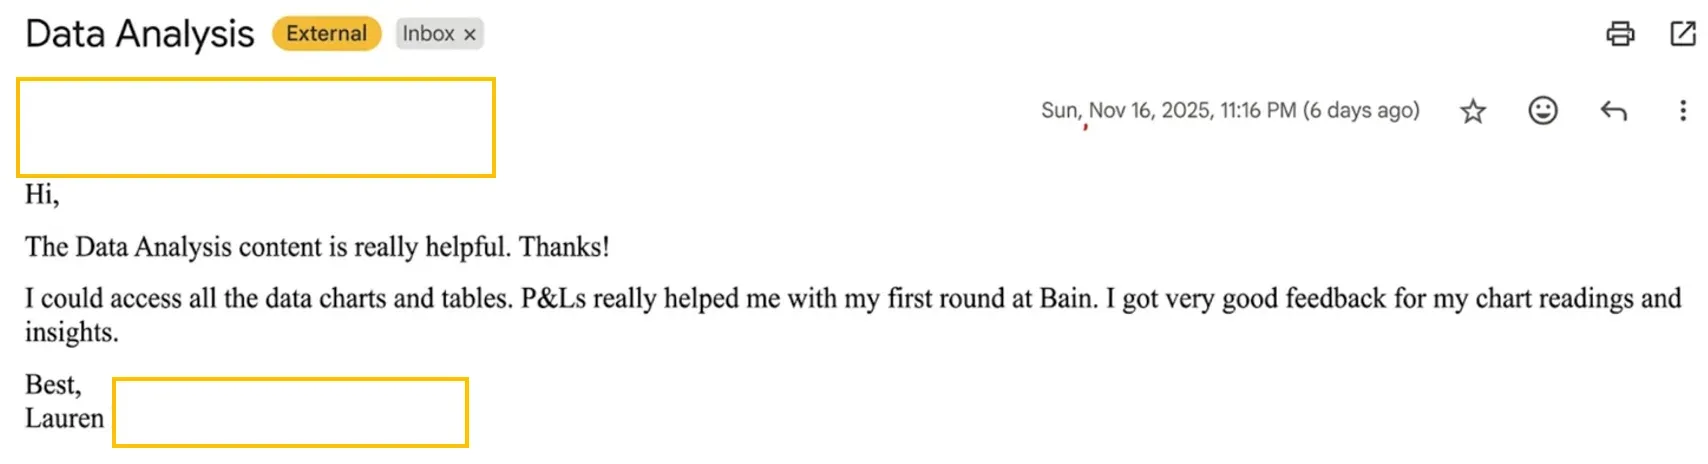
"The data practice helped me build strong chart-reading skills and clear insights!"
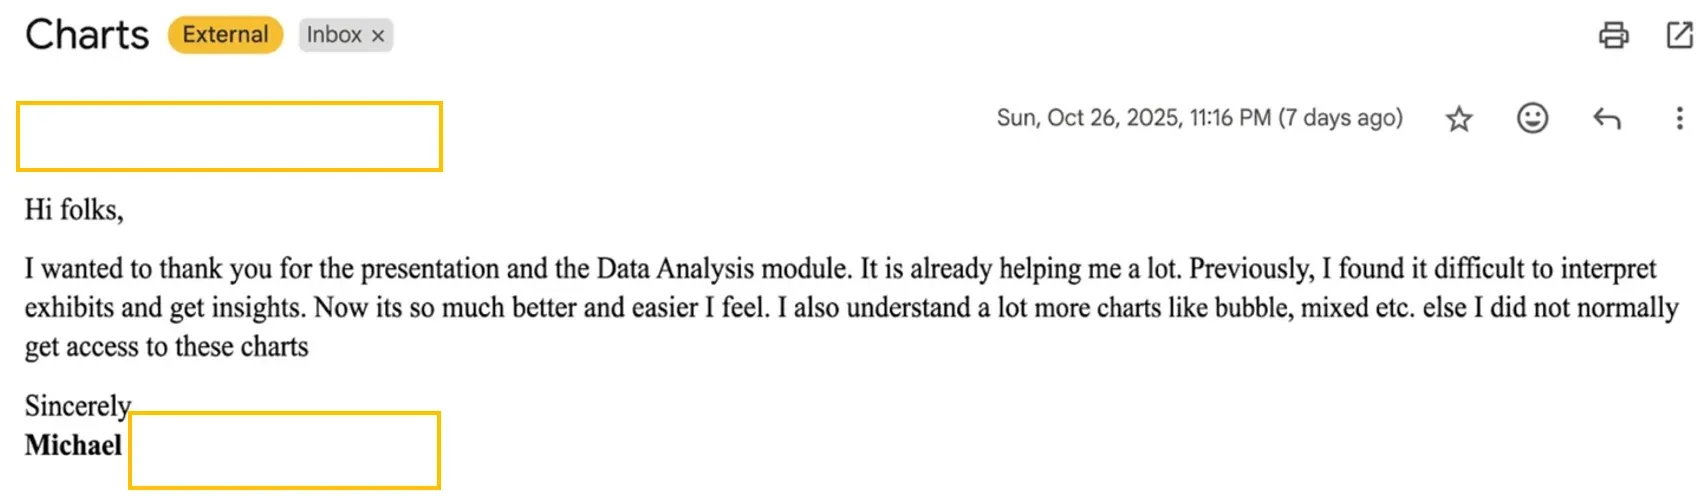
"Charts are now much easier to understand and interpret!"
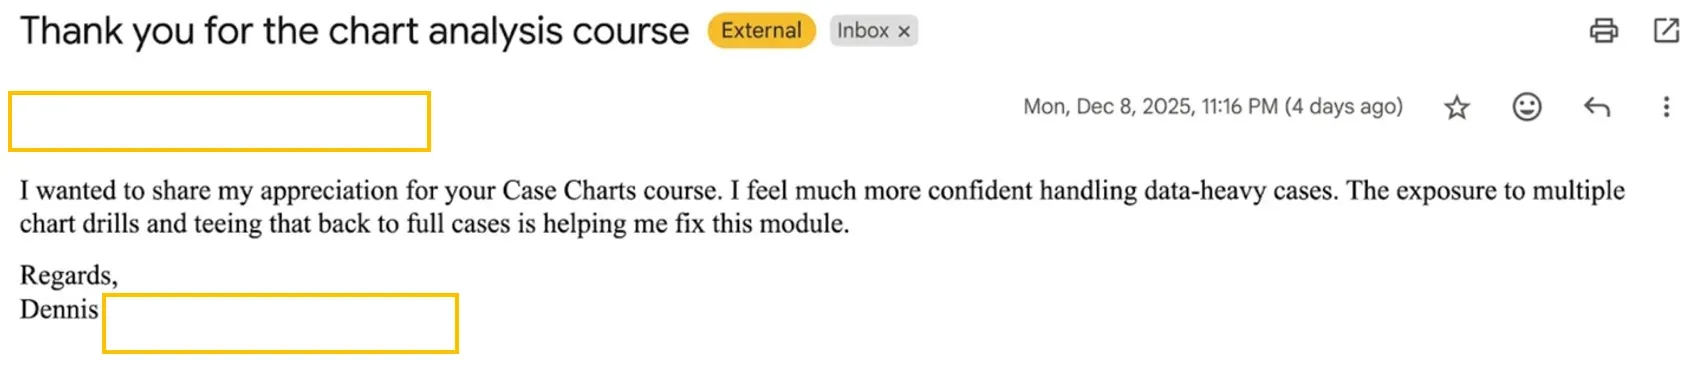
"I feel much more confident handling data-heavy cases now!"
Course Offerings

Chart Analysis All-in-One
Chart Analysis All-in-One
Chart Analysis All-in-One