Question 2/90
Fleet Mix Makeover
5 minChart Type: Bar ChartDifficulty: Easy
Prompt
Your client is a regional transport authority that licenses commercial vehicles. The authority is planning road, parking, and emissions policy and wants to understand how the composition of the licensed fleet changed between 2018 and 2019.
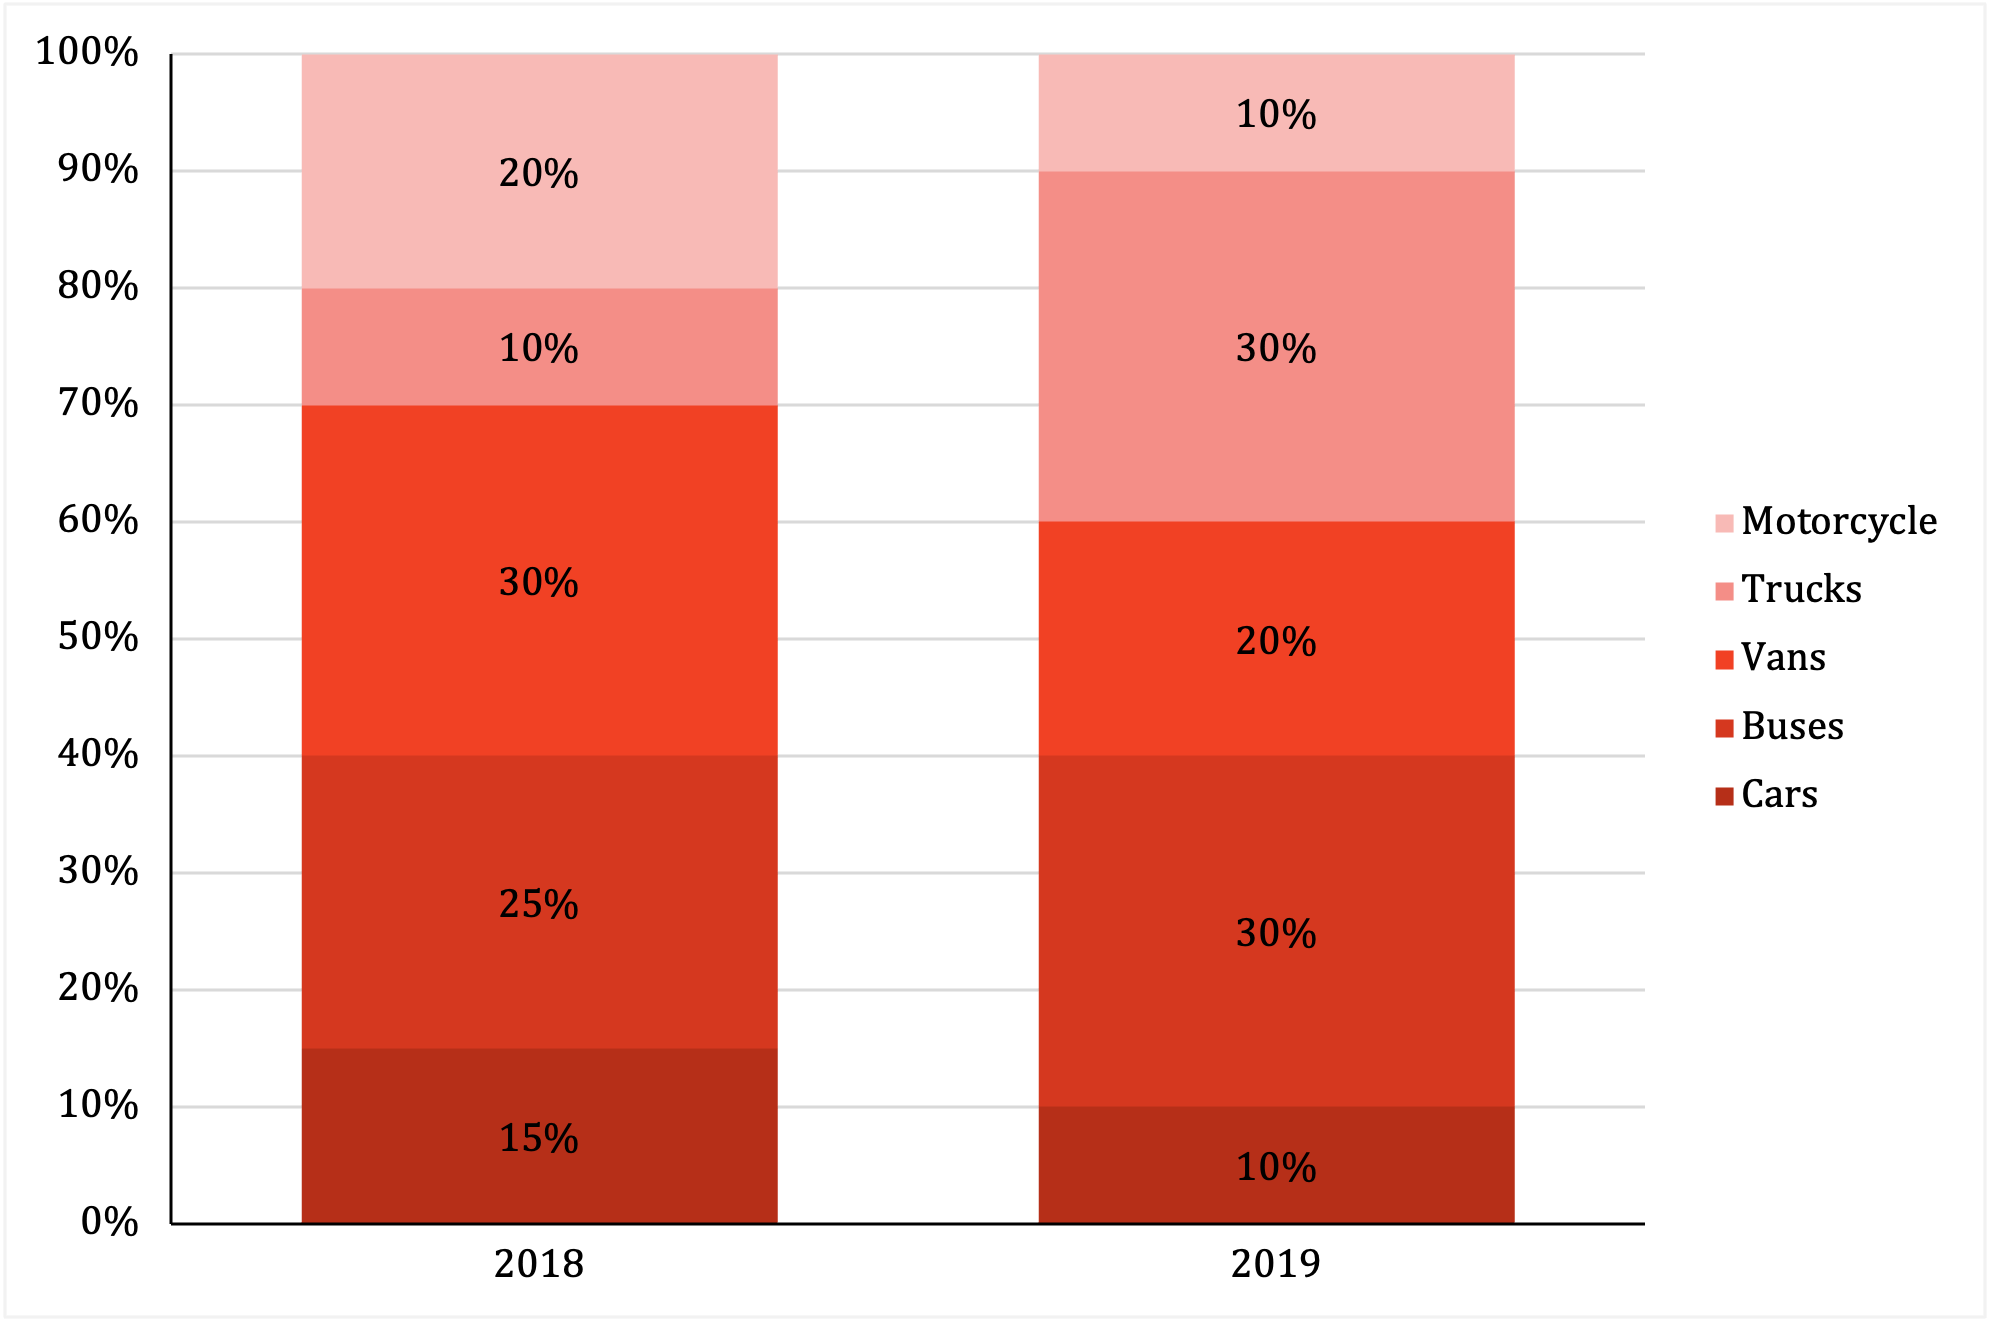
The exhibit is a 100 percent stacked bar chart showing the share of the fleet accounted for by cars, buses, vans, trucks, and motorcycles in each year. The bars show percentage shares of the total fleet, not vehicle counts.
Question: What can you conclude from this exhibit, and what should the authority watch out for when interpreting it?
Exhibit
Select key insights that are relevant and drag them to box on the right.
0/3Available
Selected
Drag items here...